Probable Regulatory Protein Embr
(All numbering and residues are taken from first PDB file)
![]()
![]()
Bending Residue Dihedral Analysis
Residue
iResidue
i+1Distance of hinge axis to residue i in
(A) Distance of hinge axis to residue i in
(A) Change in
(deg) Change in
(deg) Angle of psi(i) axis to hinge axis
(deg) Angle of psi(i) axis to hinge axis
(deg) Percentage Progress
THR-57
ALA-58
6.3
6.1
1.6
-3.8
100.1
100.3
4.2
ALA-58
LEU-59
3.0
3.0
-3.6
7.0
144.1
144.1
12.7
LEU-59
TRP-60
1.3
1.2
-3.3
3.2
136.3
136.4
-3.2
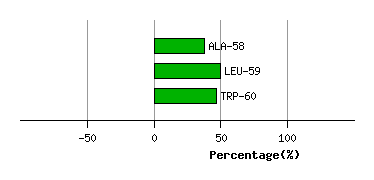
Graph shows rotational transition at bending residues and can be used
to identify hinge bending residues.
Probably only informative for interdomain rotations greater than 20 degrees
Residue
iResidue
i+1Distance of hinge axis to residue i in
(A) Distance of hinge axis to residue i in
(A) Change in
(deg) Change in
(deg) Angle of psi(i) axis to hinge axis
(deg) Angle of psi(i) axis to hinge axis
(deg) Percentage Progress
PRO-64
PRO-65
6.4
6.1
-9.2
-1.9
18.0
21.8
103.5
PRO-65
SER-66
5.9
5.6
-3.6
0.5
93.5
93.8
-9.0
SER-66
GLY-67
9.2
8.9
2.9
-0.6
69.3
70.7
24.1
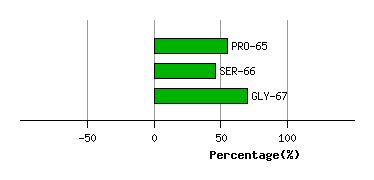
Graph shows rotational transition at bending residues and can be used
to identify hinge bending residues.
Probably only informative for interdomain rotations greater than 20 degrees
Residue
iResidue
i+1Distance of hinge axis to residue i in
(A) Distance of hinge axis to residue i in
(A) Change in
(deg) Change in
(deg) Angle of psi(i) axis to hinge axis
(deg) Angle of psi(i) axis to hinge axis
(deg) Percentage Progress
ARG-69
ALA-70
10.6
10.2
-1.3
5.3
104.9
107.1
1.9
ALA-70
SER-71
11.5
11.2
-4.1
1.5
77.6
76.7
15.1
SER-71
ILE-72
8.4
8.2
1.1
-1.9
162.7
164.2
1.1
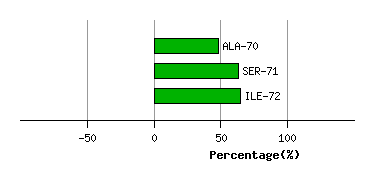
Graph shows rotational transition at bending residues and can be used
to identify hinge bending residues.
Probably only informative for interdomain rotations greater than 20 degrees
Residue
iResidue
i+1Distance of hinge axis to residue i in
(A) Distance of hinge axis to residue i in
(A) Change in
(deg) Change in
(deg) Angle of psi(i) axis to hinge axis
(deg) Angle of psi(i) axis to hinge axis
(deg) Percentage Progress
HIS-73
SER-74
12.6
12.4
-0.6
-0.3
73.7
72.7
3.5
SER-74
TYR-75
12.2
12.1
-0.8
0.2
132.0
130.2
-12.6
TYR-75
VAL-76
10.3
10.2
2.5
-0.2
38.9
37.0
24.9
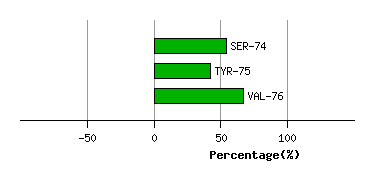
Graph shows rotational transition at bending residues and can be used
to identify hinge bending residues.
Probably only informative for interdomain rotations greater than 20 degrees
Residue
iResidue
i+1Distance of hinge axis to residue i in
(A) Distance of hinge axis to residue i in
(A) Change in
(deg) Change in
(deg) Angle of psi(i) axis to hinge axis
(deg) Angle of psi(i) axis to hinge axis
(deg) Percentage Progress
ASP-155
PHE-156
10.4
10.6
5.2
-13.0
94.7
98.2
10.7
PHE-156
GLN-157
7.0
7.3
-2.6
-4.4
43.1
41.8
77.5
GLN-157
PHE-158
8.4
8.7
0.4
3.5
160.0
156.9
-65.2
PHE-158
VAL-159
6.0
6.1
-4.7
4.4
56.6
55.8
-61.9
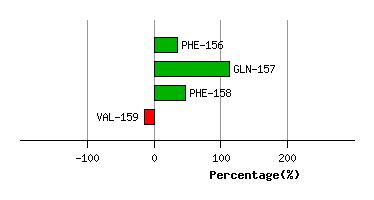
Graph shows rotational transition at bending residues and can be used
to identify hinge bending residues.
Probably only informative for interdomain rotations greater than 20 degrees
Residue
iResidue
i+1Distance of hinge axis to residue i in
(A) Distance of hinge axis to residue i in
(A) Change in
(deg) Change in
(deg) Angle of psi(i) axis to hinge axis
(deg) Angle of psi(i) axis to hinge axis
(deg) Percentage Progress
ALA-270
ALA-271
12.3
12.4
-0.4
2.1
64.0
65.7
25.4
ALA-271
GLY-272
10.2
10.2
-1.3
0.7
117.9
121.7
-10.4
GLY-272
THR-273
10.6
10.6
-7.6
7.4
141.4
141.6
-4.8
THR-273
VAL-274
8.9
9.1
-0.8
-2.1
75.3
75.7
53.5
VAL-274
THR-275
6.1
6.3
4.1
-4.3
93.0
92.1
-40.9
THR-275
VAL-276
5.6
5.7
4.7
5.2
28.8
25.0
128.1
VAL-276
LEU-277
5.7
5.9
-6.6
4.3
109.0
105.9
-32.6
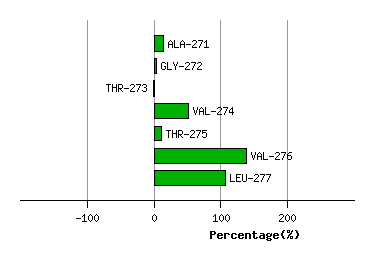
Graph shows rotational transition at bending residues and can be used
to identify hinge bending residues.
Probably only informative for interdomain rotations greater than 20 degrees
Residue
iResidue
i+1Distance of hinge axis to residue i in
(A) Distance of hinge axis to residue i in
(A) Change in
(deg) Change in
(deg) Angle of psi(i) axis to hinge axis
(deg) Angle of psi(i) axis to hinge axis
(deg) Percentage Progress
ASP-334
THR-335
4.0
3.9
-4.4
1.5
80.8
78.5
46.6
THR-335
GLY-336
4.9
4.9
4.3
-2.1
56.0
58.8
-1.5
GLY-336
THR-337
3.3
3.4
4.0
-7.6
30.9
28.2
-31.7
THR-337
ASN-338
5.6
5.5
-5.1
0.4
96.8
100.1
4.3
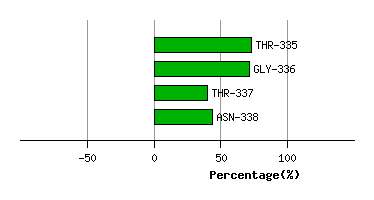
Graph shows rotational transition at bending residues and can be used
to identify hinge bending residues.
Probably only informative for interdomain rotations greater than 20 degrees