Pyruvate,orthophosphate Dikinase
(All numbering and residues are taken from first PDB file)
![]()
![]()
Bending Residue Dihedral Analysis
Residue
iResidue
i+1Distance of hinge axis to residue i in
(A) Distance of hinge axis to residue i in
(A) Change in
(deg) Change in
(deg) Angle of psi(i) axis to hinge axis
(deg) Angle of psi(i) axis to hinge axis
(deg) Percentage Progress
ASN-386
PRO-387
34.5
34.1
3.7
8.8
70.3
69.7
162.7
PRO-387
SER-388
33.0
32.9
-3.0
-11.4
117.6
125.3
-90.0
SER-388
ALA-389
36.4
36.3
-7.6
9.7
173.9
157.8
55.1
ALA-389
TYR-390
35.8
35.9
-11.4
-1.6
120.0
127.8
-143.3
TYR-390
LYS-391
32.9
33.0
10.6
-14.7
88.1
86.0
2.7
LYS-391
ASP-392
35.0
35.0
-4.2
10.0
150.4
162.9
86.7
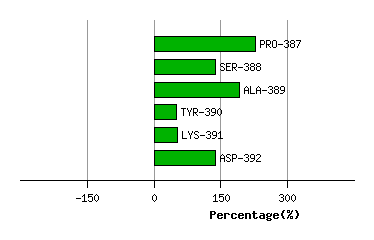
Graph shows rotational transition at bending residues and can be used
to identify hinge bending residues.
Probably only informative for interdomain rotations greater than 20 degrees
Residue
iResidue
i+1Distance of hinge axis to residue i in
(A) Distance of hinge axis to residue i in
(A) Change in
(deg) Change in
(deg) Angle of psi(i) axis to hinge axis
(deg) Angle of psi(i) axis to hinge axis
(deg) Percentage Progress
GLN-393
VAL-394
31.0
31.5
-2.4
7.4
121.7
117.7
116.9
VAL-394
ILE-395
30.6
30.7
20.6
-13.9
124.1
128.3
-92.4
ILE-395
ALA-396
29.4
29.4
9.8
-14.6
58.8
60.6
-98.3
ALA-396
THR-397
29.1
29.3
9.5
-7.4
14.9
13.2
14.5
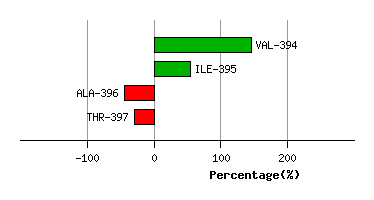
Graph shows rotational transition at bending residues and can be used
to identify hinge bending residues.
Probably only informative for interdomain rotations greater than 20 degrees
Residue
iResidue
i+1Distance of hinge axis to residue i in
(A) Distance of hinge axis to residue i in
(A) Change in
(deg) Change in
(deg) Angle of psi(i) axis to hinge axis
(deg) Angle of psi(i) axis to hinge axis
(deg) Percentage Progress
LEU-399
PRO-400
26.7
26.5
-2.7
15.4
105.1
108.7
241.1
PRO-400
ALA-401
25.6
25.1
-16.5
20.5
131.1
121.1
137.5
ALA-401
SER-402
22.5
21.9
-9.8
-2.0
121.5
124.1
-91.8
SER-402
PRO-403
20.9
20.4
-5.2
7.0
70.4
70.9
-7.2
PRO-403
GLY-404
23.0
22.8
-1.4
6.1
114.3
113.4
67.9
PRO-403
GLY-404
23.0
22.8
-1.4
6.1
114.3
113.4
67.9
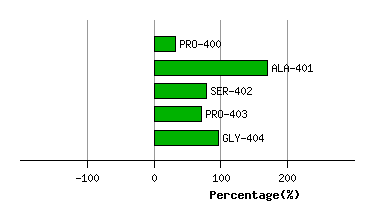
Graph shows rotational transition at bending residues and can be used
to identify hinge bending residues.
Probably only informative for interdomain rotations greater than 20 degrees
Residue
iResidue
i+1Distance of hinge axis to residue i in
(A) Distance of hinge axis to residue i in
(A) Change in
(deg) Change in
(deg) Angle of psi(i) axis to hinge axis
(deg) Angle of psi(i) axis to hinge axis
(deg) Percentage Progress
PRO-403
GLY-404
23.0
22.8
-1.4
6.1
114.3
113.4
67.9
PRO-403
GLY-404
23.0
22.8
-1.4
6.1
114.3
113.4
67.9
GLY-404
ALA-405
22.9
22.7
-0.8
2.0
172.5
170.9
37.1
ALA-405
ALA-406
23.5
23.5
0.2
-6.0
64.4
63.8
-80.5
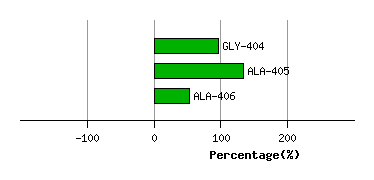
Graph shows rotational transition at bending residues and can be used
to identify hinge bending residues.
Probably only informative for interdomain rotations greater than 20 degrees
Residue
iResidue
i+1Distance of hinge axis to residue i in
(A) Distance of hinge axis to residue i in
(A) Change in
(deg) Change in
(deg) Angle of psi(i) axis to hinge axis
(deg) Angle of psi(i) axis to hinge axis
(deg) Percentage Progress
LYS-468
CYS-469
16.2
16.0
3.0
-6.4
114.5
110.1
22.8
CYS-469
CYS-470
19.1
18.9
9.7
-8.1
115.4
113.0
41.1
CYS-470
VAL-471
19.3
19.2
-3.8
-2.7
83.6
84.8
-44.9
VAL-471
SER-472
22.2
22.1
-16.9
10.0
81.9
77.8
-47.9
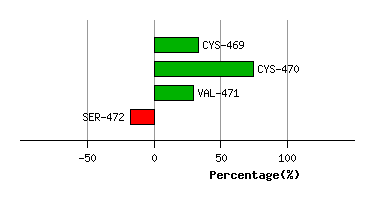
Graph shows rotational transition at bending residues and can be used
to identify hinge bending residues.
Probably only informative for interdomain rotations greater than 20 degrees
Residue
iResidue
i+1Distance of hinge axis to residue i in
(A) Distance of hinge axis to residue i in
(A) Change in
(deg) Change in
(deg) Angle of psi(i) axis to hinge axis
(deg) Angle of psi(i) axis to hinge axis
(deg) Percentage Progress
LEU-499
SER-500
21.3
21.3
-7.1
7.8
155.9
160.2
-9.1
SER-500
LEU-501
23.1
23.1
-8.1
9.3
127.5
126.7
47.1
LEU-501
ASN-502
23.1
22.9
-4.1
4.6
146.7
149.5
38.4
ASN-502
GLY-503
25.3
25.0
-0.5
-3.0
127.6
129.5
-64.4

Graph shows rotational transition at bending residues and can be used
to identify hinge bending residues.
Probably only informative for interdomain rotations greater than 20 degrees
Residue
iResidue
i+1Distance of hinge axis to residue i in
(A) Distance of hinge axis to residue i in
(A) Change in
(deg) Change in
(deg) Angle of psi(i) axis to hinge axis
(deg) Angle of psi(i) axis to hinge axis
(deg) Percentage Progress
GLY-506
GLU-507
27.0
27.0
-8.0
2.7
14.4
10.0
98.3
GLU-507
VAL-508
28.0
28.0
17.8
-16.3
126.5
123.2
-14.3
VAL-508
ILE-509
25.8
25.7
-27.7
38.5
46.6
41.7
-115.5
ILE-509
LEU-510
26.9
27.2
37.6
-39.0
141.5
141.8
12.1
LEU-510
GLY-511
25.9
26.0
-5.7
7.9
87.4
81.5
20.0
LEU-510
GLY-511
25.9
26.0
-5.7
7.9
87.4
81.5
20.0
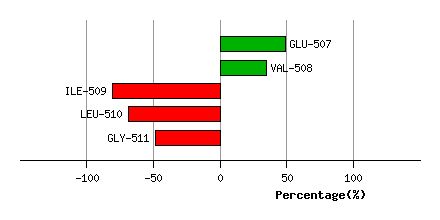
Graph shows rotational transition at bending residues and can be used
to identify hinge bending residues.
Probably only informative for interdomain rotations greater than 20 degrees
Residue
iResidue
i+1Distance of hinge axis to residue i in
(A) Distance of hinge axis to residue i in
(A) Change in
(deg) Change in
(deg) Angle of psi(i) axis to hinge axis
(deg) Angle of psi(i) axis to hinge axis
(deg) Percentage Progress
LEU-510
GLY-511
25.9
26.0
-5.7
7.9
87.4
81.5
20.0
LEU-510
GLY-511
25.9
26.0
-5.7
7.9
87.4
81.5
20.0
GLY-511
LYS-512
24.9
24.9
14.1
-0.8
34.1
37.7
290.1
LYS-512
GLN-513
24.6
24.8
-17.2
3.7
115.1
120.8
-203.0
GLN-513
PRO-514
27.5
27.6
0.5
-9.3
125.1
129.0
41.1
GLN-513
PRO-514
27.5
27.6
0.5
-9.3
125.1
129.0
41.1
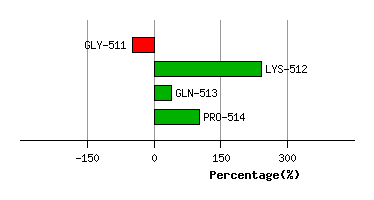
Graph shows rotational transition at bending residues and can be used
to identify hinge bending residues.
Probably only informative for interdomain rotations greater than 20 degrees
Residue
iResidue
i+1Distance of hinge axis to residue i in
(A) Distance of hinge axis to residue i in
(A) Change in
(deg) Change in
(deg) Angle of psi(i) axis to hinge axis
(deg) Angle of psi(i) axis to hinge axis
(deg) Percentage Progress
GLN-513
PRO-514
27.5
27.6
0.5
-9.3
125.1
129.0
41.1
GLN-513
PRO-514
27.5
27.6
0.5
-9.3
125.1
129.0
41.1
PRO-514
LEU-515
28.6
28.7
10.2
-4.4
162.0
164.2
-164.3
LEU-515
SER-516
27.0
27.5
8.5
-13.7
123.1
122.7
212.9
SER-516
PRO-517
29.4
29.9
10.3
-12.5
72.2
71.1
-34.3
SER-516
PRO-517
29.4
29.9
10.3
-12.5
72.2
71.1
-34.3
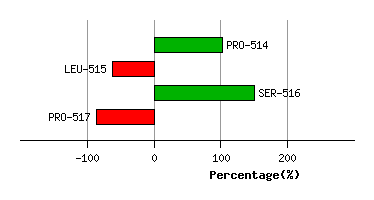
Graph shows rotational transition at bending residues and can be used
to identify hinge bending residues.
Probably only informative for interdomain rotations greater than 20 degrees
Residue
iResidue
i+1Distance of hinge axis to residue i in
(A) Distance of hinge axis to residue i in
(A) Change in
(deg) Change in
(deg) Angle of psi(i) axis to hinge axis
(deg) Angle of psi(i) axis to hinge axis
(deg) Percentage Progress
SER-516
PRO-517
29.4
29.9
10.3
-12.5
72.2
71.1
-34.3
SER-516
PRO-517
29.4
29.9
10.3
-12.5
72.2
71.1
-34.3
PRO-517
PRO-518
29.5
29.7
9.0
8.8
8.5
4.4
368.3
PRO-518
ALA-519
28.4
28.8
-8.6
-3.6
122.3
118.6
-167.3
ALA-519
LEU-520
30.7
31.3
-13.8
17.9
105.3
116.0
-32.4
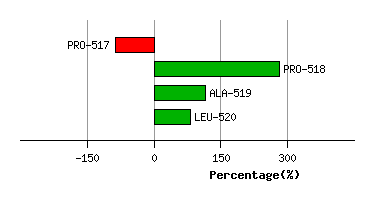
Graph shows rotational transition at bending residues and can be used
to identify hinge bending residues.
Probably only informative for interdomain rotations greater than 20 degrees