Nickel-Binding Periplasmic Protein
(All numbering and residues are taken from first PDB file)
![]()
![]()
Bending Residue Dihedral Analysis
Residue
iResidue
i+1Distance of hinge axis to residue i in
(A) Distance of hinge axis to residue i in
(A) Change in
(deg) Change in
(deg) Angle of psi(i) axis to hinge axis
(deg) Angle of psi(i) axis to hinge axis
(deg) Percentage Progress
PRO-225
LEU-226
21.4
23.1
1.3
-9.3
37.5
51.3
-79.6
LEU-226
ASP-227
19.5
20.5
8.6
-3.4
54.9
51.4
65.9
ASP-227
THR-228
22.1
22.6
4.7
-2.5
116.5
121.6
6.7
THR-228
PHE-229
22.4
23.2
3.3
5.8
83.6
97.1
-66.8
PHE-229
ALA-230
18.7
19.6
-1.9
-3.9
156.8
144.8
7.2
ALA-230
ARG-231
18.8
19.3
2.2
-7.3
83.8
86.3
3.0
ARG-231
PHE-232
22.0
22.5
11.7
-2.7
116.4
131.3
-47.3
PHE-232
SER-233
20.6
21.4
0.2
-2.3
61.7
67.9
60.1
SER-233
GLN-234
17.6
18.4
4.7
-17.0
37.9
47.8
-78.8
GLN-234
ASN-235
20.1
20.7
18.7
-3.0
107.9
117.3
42.3
ASN-235
PRO-236
22.5
23.2
-2.6
0.5
67.1
57.6
-17.3
PRO-236
ALA-237
22.0
22.9
-1.4
-2.0
26.6
21.2
66.1
ALA-237
TYR-238
24.1
24.6
8.9
-1.8
135.8
124.0
-14.0
TYR-238
HIS-239
20.9
21.4
-6.6
-7.8
106.7
99.6
-87.5
HIS-239
THR-240
17.3
17.8
-8.8
2.0
86.7
98.2
21.4
THR-240
GLN-241
14.8
15.4
-4.2
0.4
98.1
105.6
-23.7
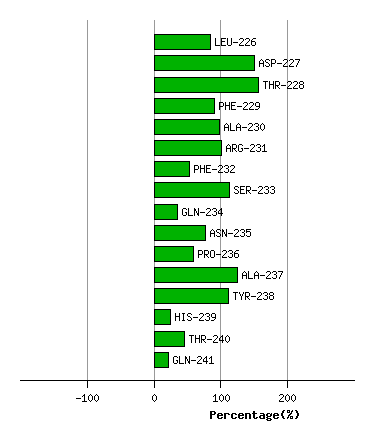
Graph shows rotational transition at bending residues and can be used
to identify hinge bending residues.
Probably only informative for interdomain rotations greater than 20 degrees
Residue
iResidue
i+1Distance of hinge axis to residue i in
(A) Distance of hinge axis to residue i in
(A) Change in
(deg) Change in
(deg) Angle of psi(i) axis to hinge axis
(deg) Angle of psi(i) axis to hinge axis
(deg) Percentage Progress
ILE-246
GLU-247
9.5
8.5
61.0
-70.5
72.6
89.7
16.4
GLU-247
THR-248
13.1
12.1
-2.4
-1.4
176.3
156.5
40.7
THR-248
VAL-249
14.6
14.2
9.7
-5.5
90.7
94.0
-167.9
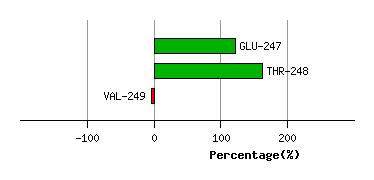
Graph shows rotational transition at bending residues and can be used
to identify hinge bending residues.
Probably only informative for interdomain rotations greater than 20 degrees
Residue
iResidue
i+1Distance of hinge axis to residue i in
(A) Distance of hinge axis to residue i in
(A) Change in
(deg) Change in
(deg) Angle of psi(i) axis to hinge axis
(deg) Angle of psi(i) axis to hinge axis
(deg) Percentage Progress
ARG-396
THR-397
19.3
18.9
1.4
5.5
59.5
60.3
-20.6
THR-397
ALA-398
17.2
16.9
0.4
0.8
37.6
28.6
171.4
ALA-398
GLY-399
15.5
15.9
15.3
14.4
90.4
72.7
71.4
GLY-399
ALA-400
12.0
12.1
-48.2
-114.8
149.2
121.1
-1506.7
ALA-400
PRO-401
9.7
9.9
-68.9
-12.4
102.6
163.3
1351.1
PRO-401
ALA-402
10.9
11.1
26.2
-9.7
96.8
104.6
-69.0
ALA-402
ASP-403
14.6
14.6
6.4
0.2
149.8
152.7
-144.9
ASP-403
PRO-404
14.8
14.5
-17.0
-12.2
77.8
82.3
123.5
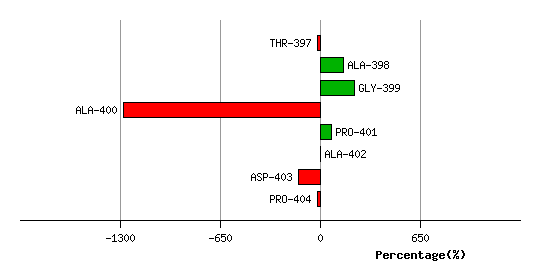
Graph shows rotational transition at bending residues and can be used
to identify hinge bending residues.
Probably only informative for interdomain rotations greater than 20 degrees
Residue
iResidue
i+1Distance of hinge axis to residue i in
(A) Distance of hinge axis to residue i in
(A) Change in
(deg) Change in
(deg) Angle of psi(i) axis to hinge axis
(deg) Angle of psi(i) axis to hinge axis
(deg) Percentage Progress
SER-468
TYR-469
13.9
13.8
0.7
1.1
27.7
29.3
9.9
TYR-469
ILE-470
11.6
11.4
-8.1
19.4
119.9
120.5
-71.7
ILE-470
SER-471
12.3
12.0
3.8
6.5
63.2
70.7
177.5
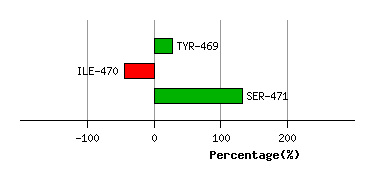
Graph shows rotational transition at bending residues and can be used
to identify hinge bending residues.
Probably only informative for interdomain rotations greater than 20 degrees
Residue
iResidue
i+1Distance of hinge axis to residue i in
(A) Distance of hinge axis to residue i in
(A) Change in
(deg) Change in
(deg) Angle of psi(i) axis to hinge axis
(deg) Angle of psi(i) axis to hinge axis
(deg) Percentage Progress
VAL-474
VAL-475
13.2
13.4
-4.6
8.0
119.7
112.8
37.3
VAL-475
SER-476
16.5
17.0
-3.5
-2.9
41.7
33.1
75.0
SER-476
LYS-477
17.8
17.7
-4.7
-7.6
108.2
98.5
31.1
LYS-477
PRO-478
20.9
20.6
-7.5
-7.1
105.1
98.2
44.8
PRO-478
GLU-479
20.8
20.1
11.2
7.2
138.6
143.4
-106.8
GLU-479
LEU-480
21.8
21.0
-4.0
-3.4
56.5
62.4
35.4
LEU-480
GLY-481
18.5
17.5
26.9
-29.2
72.1
63.6
-118.9
GLY-481
ASN-482
16.4
16.3
39.3
-10.2
71.5
63.5
158.4
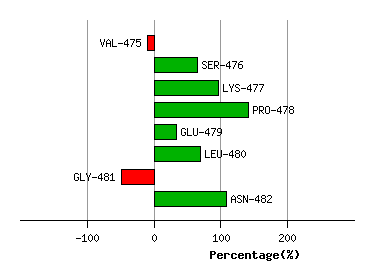
Graph shows rotational transition at bending residues and can be used
to identify hinge bending residues.
Probably only informative for interdomain rotations greater than 20 degrees
Residue
iResidue
i+1Distance of hinge axis to residue i in
(A) Distance of hinge axis to residue i in
(A) Change in
(deg) Change in
(deg) Angle of psi(i) axis to hinge axis
(deg) Angle of psi(i) axis to hinge axis
(deg) Percentage Progress
PRO-484
TYR-485
7.1
6.7
25.2
-32.1
83.0
93.4
21.3
TYR-485
ALA-486
4.3
4.4
-11.2
25.4
123.4
128.9
99.5
ALA-486
PRO-487
1.7
3.1
-25.6
7.2
62.9
60.0
57.3
PRO-487
ILE-488
2.6
3.4
-12.3
31.2
95.1
93.5
136.0
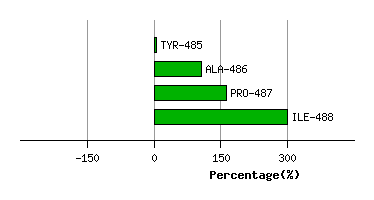
Graph shows rotational transition at bending residues and can be used
to identify hinge bending residues.
Probably only informative for interdomain rotations greater than 20 degrees
Residue
iResidue
i+1Distance of hinge axis to residue i in
(A) Distance of hinge axis to residue i in
(A) Change in
(deg) Change in
(deg) Angle of psi(i) axis to hinge axis
(deg) Angle of psi(i) axis to hinge axis
(deg) Percentage Progress
GLU-491
ILE-492
5.9
7.9
87.2
-74.8
76.5
64.9
186.2
ILE-492
PRO-493
7.4
8.1
7.3
-7.7
126.6
121.3
49.0
PRO-493
PHE-494
6.2
6.0
-9.9
0.8
69.2
67.4
10.2
PHE-494
GLU-495
9.4
9.1
-13.1
5.4
67.8
63.5
156.3
GLU-495
GLN-496
9.2
7.5
0.9
-17.3
45.0
54.2
-131.8
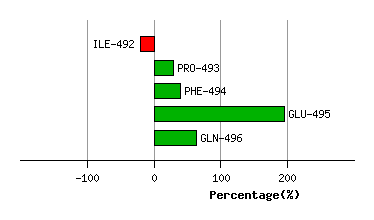
Graph shows rotational transition at bending residues and can be used
to identify hinge bending residues.
Probably only informative for interdomain rotations greater than 20 degrees