DNA Polymerase
(All numbering and residues are taken from first PDB file)
![]()
![]()
Bending Residue Dihedral Analysis
Residue
iResidue
i+1Distance of hinge axis to residue i in
(A) Distance of hinge axis to residue i in
(A) Change in
(deg) Change in
(deg) Angle of psi(i) axis to hinge axis
(deg) Angle of psi(i) axis to hinge axis
(deg) Percentage Progress
LEU-730
GLU-731
25.1
25.1
-157.6
128.6
71.6
71.9
-2.5
GLU-731
THR-732
22.2
23.0
18.6
-14.3
47.7
51.8
43.1
THR-732
GLN-733
21.4
21.2
-154.7
178.0
73.4
91.4
-69.4
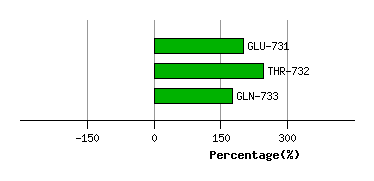
Graph shows rotational transition at bending residues and can be used
to identify hinge bending residues.
Probably only informative for interdomain rotations greater than 20 degrees
Residue
iResidue
i+1Distance of hinge axis to residue i in
(A) Distance of hinge axis to residue i in
(A) Change in
(deg) Change in
(deg) Angle of psi(i) axis to hinge axis
(deg) Angle of psi(i) axis to hinge axis
(deg) Percentage Progress
PRO-738
LYS-739
13.9
13.2
-9.3
7.7
25.8
32.5
24.9
LYS-739
ALA-740
15.7
15.6
-4.4
-13.4
56.7
43.7
109.7
ALA-740
VAL-741
12.3
12.9
45.8
-39.8
82.3
78.2
-39.8
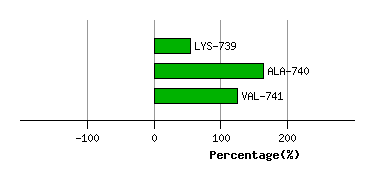
Graph shows rotational transition at bending residues and can be used
to identify hinge bending residues.
Probably only informative for interdomain rotations greater than 20 degrees
Residue
iResidue
i+1Distance of hinge axis to residue i in
(A) Distance of hinge axis to residue i in
(A) Change in
(deg) Change in
(deg) Angle of psi(i) axis to hinge axis
(deg) Angle of psi(i) axis to hinge axis
(deg) Percentage Progress
LYS-765
GLU-766
11.5
11.4
-13.9
13.4
118.9
104.7
-1.9
GLU-766
PHE-767
9.3
9.0
-59.8
40.4
56.6
43.0
118.7
PHE-767
GLU-768
8.5
8.9
3.1
-7.0
126.0
135.7
7.7
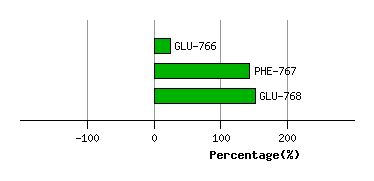
Graph shows rotational transition at bending residues and can be used
to identify hinge bending residues.
Probably only informative for interdomain rotations greater than 20 degrees
Residue
iResidue
i+1Distance of hinge axis to residue i in
(A) Distance of hinge axis to residue i in
(A) Change in
(deg) Change in
(deg) Angle of psi(i) axis to hinge axis
(deg) Angle of psi(i) axis to hinge axis
(deg) Percentage Progress
ASP-867
TYR-868
1.6
1.1
-22.0
10.4
46.7
43.0
89.1
TYR-868
THR-869
2.8
2.6
-22.5
19.7
97.5
97.0
41.2
THR-869
VAL-870
6.3
5.8
21.5
-23.1
49.7
50.1
3.5
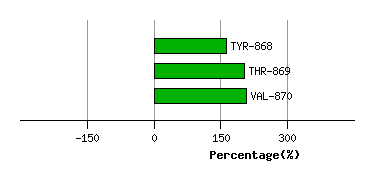
Graph shows rotational transition at bending residues and can be used
to identify hinge bending residues.
Probably only informative for interdomain rotations greater than 20 degrees