Caffeic Acid 3-O-Methyltransferase
(All numbering and residues are taken from first PDB file)
![]()
![]()
Bending Residue Dihedral Analysis
Residue
iResidue
i+1Distance of hinge axis to residue i in
(A) Distance of hinge axis to residue i in
(A) Change in
(deg) Change in
(deg) Angle of psi(i) axis to hinge axis
(deg) Angle of psi(i) axis to hinge axis
(deg) Percentage Progress
SER-203
LEU-204
13.0
12.6
-24.7
-1.5
29.3
23.9
384.2
LEU-204
VAL-205
12.2
12.0
-11.6
4.6
44.3
46.9
80.3
VAL-205
ASP-206
14.1
14.1
2.6
9.4
143.9
148.7
-154.2
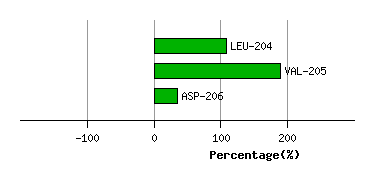
Graph shows rotational transition at bending residues and can be used
to identify hinge bending residues.
Probably only informative for interdomain rotations greater than 20 degrees
Residue
iResidue
i+1Distance of hinge axis to residue i in
(A) Distance of hinge axis to residue i in
(A) Change in
(deg) Change in
(deg) Angle of psi(i) axis to hinge axis
(deg) Angle of psi(i) axis to hinge axis
(deg) Percentage Progress
VAL-219
SER-220
13.4
13.0
-15.4
23.2
66.1
63.4
-30.7
SER-220
LYS-221
14.8
14.8
2.8
-8.0
110.5
114.7
47.7
LYS-221
TYR-222
11.9
11.8
5.8
-2.8
145.8
139.6
-11.6
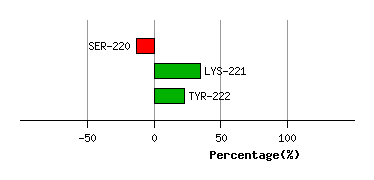
Graph shows rotational transition at bending residues and can be used
to identify hinge bending residues.
Probably only informative for interdomain rotations greater than 20 degrees
Residue
iResidue
i+1Distance of hinge axis to residue i in
(A) Distance of hinge axis to residue i in
(A) Change in
(deg) Change in
(deg) Angle of psi(i) axis to hinge axis
(deg) Angle of psi(i) axis to hinge axis
(deg) Percentage Progress
ILE-225
LYS-226
11.8
11.4
-5.7
0.6
76.1
78.9
9.3
LYS-226
GLY-227
15.3
14.9
-21.1
7.9
6.0
5.1
218.5
GLY-227
ILE-228
15.6
15.0
-1.8
2.9
62.5
61.5
-24.7
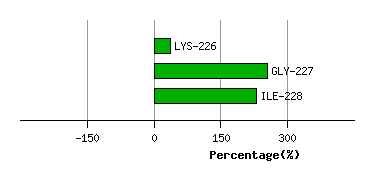
Graph shows rotational transition at bending residues and can be used
to identify hinge bending residues.
Probably only informative for interdomain rotations greater than 20 degrees
Residue
iResidue
i+1Distance of hinge axis to residue i in
(A) Distance of hinge axis to residue i in
(A) Change in
(deg) Change in
(deg) Angle of psi(i) axis to hinge axis
(deg) Angle of psi(i) axis to hinge axis
(deg) Percentage Progress
ALA-261
VAL-262
10.9
10.7
-2.1
-10.9
141.7
139.0
-193.4
VAL-262
PHE-263
11.1
11.1
-1.9
8.3
119.0
120.8
35.0
PHE-263
MET-264
9.0
8.9
16.0
-6.0
24.6
25.1
186.2
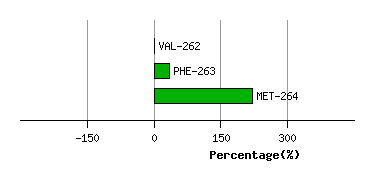
Graph shows rotational transition at bending residues and can be used
to identify hinge bending residues.
Probably only informative for interdomain rotations greater than 20 degrees
Residue
iResidue
i+1Distance of hinge axis to residue i in
(A) Distance of hinge axis to residue i in
(A) Change in
(deg) Change in
(deg) Angle of psi(i) axis to hinge axis
(deg) Angle of psi(i) axis to hinge axis
(deg) Percentage Progress
TRP-266
ILE-267
7.4
7.7
5.0
3.6
101.9
102.3
-10.8
ILE-267
CYS-268
10.2
10.3
-11.1
9.0
57.3
53.7
55.8
CYS-268
HIS-269
9.4
9.6
-6.3
4.9
17.7
19.1
3.8
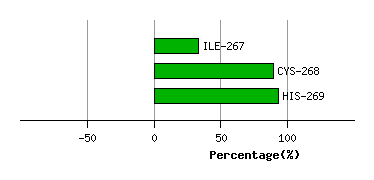
Graph shows rotational transition at bending residues and can be used
to identify hinge bending residues.
Probably only informative for interdomain rotations greater than 20 degrees
Residue
iResidue
i+1Distance of hinge axis to residue i in
(A) Distance of hinge axis to residue i in
(A) Change in
(deg) Change in
(deg) Angle of psi(i) axis to hinge axis
(deg) Angle of psi(i) axis to hinge axis
(deg) Percentage Progress
ALA-286
LEU-287
18.8
19.1
8.2
6.3
130.6
137.1
-124.8
LEU-287
PRO-288
16.3
16.6
46.8
10.3
121.0
137.7
-607.6
PRO-288
ASP-289
18.0
17.2
148.9
-119.6
102.6
78.4
50.3
ASP-289
ASN-290
16.3
17.8
-47.3
-43.5
42.7
104.5
398.8
ASN-290
GLY-291
13.9
14.2
100.8
24.2
61.5
63.6
1118.2
GLY-291
LYS-292
11.2
12.6
-3.2
-38.1
155.4
142.8
-679.4
LYS-292
VAL-293
10.3
10.5
-30.2
0.8
130.6
129.3
-356.0
VAL-293
ILE-294
9.7
9.6
-1.0
2.9
106.3
104.4
30.5
ILE-294
VAL-295
6.1
6.0
-5.2
12.5
158.3
158.2
106.0
VAL-295
ALA-296
5.5
5.5
6.2
-8.3
70.9
72.2
31.0
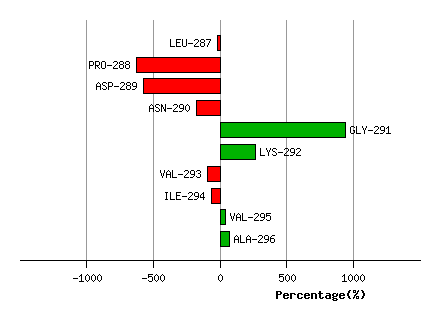
Graph shows rotational transition at bending residues and can be used
to identify hinge bending residues.
Probably only informative for interdomain rotations greater than 20 degrees
Residue
iResidue
i+1Distance of hinge axis to residue i in
(A) Distance of hinge axis to residue i in
(A) Change in
(deg) Change in
(deg) Angle of psi(i) axis to hinge axis
(deg) Angle of psi(i) axis to hinge axis
(deg) Percentage Progress
CYS-298
ILE-299
0.8
0.8
-1.0
6.9
98.9
95.8
-16.4
ILE-299
LEU-300
4.1
3.9
-12.0
14.7
143.6
147.0
65.1
LEU-300
PRO-301
5.8
5.4
-10.3
-3.7
86.6
88.9
-24.0
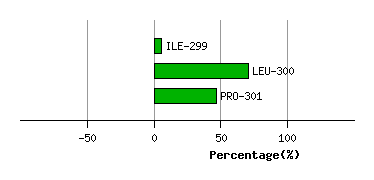
Graph shows rotational transition at bending residues and can be used
to identify hinge bending residues.
Probably only informative for interdomain rotations greater than 20 degrees
Residue
iResidue
i+1Distance of hinge axis to residue i in
(A) Distance of hinge axis to residue i in
(A) Change in
(deg) Change in
(deg) Angle of psi(i) axis to hinge axis
(deg) Angle of psi(i) axis to hinge axis
(deg) Percentage Progress
ALA-322
HIS-323
9.1
8.8
-8.8
3.5
110.1
107.9
2.4
HIS-323
ASN-324
12.0
11.8
16.0
-11.6
58.0
57.8
56.8
ASN-324
PRO-325
12.0
12.2
1.6
3.1
109.5
112.8
-122.7
PRO-325
GLY-326
13.6
14.0
-157.9
175.6
125.6
116.2
173.3
GLY-326
GLY-327
12.3
12.8
-4.5
0.1
140.0
126.9
-71.6
GLY-327
LYS-328
9.8
9.8
5.2
-6.6
104.8
112.1
-34.6
LYS-328
GLU-329
6.6
6.6
5.5
-4.3
37.9
36.5
12.7
GLU-329
ARG-330
4.0
4.0
8.7
-5.8
85.7
83.7
17.4
ARG-330
THR-331
6.5
6.4
4.7
-8.6
68.0
66.3
-61.6
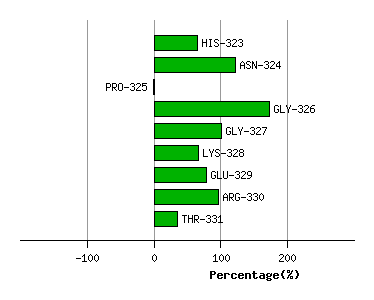
Graph shows rotational transition at bending residues and can be used
to identify hinge bending residues.
Probably only informative for interdomain rotations greater than 20 degrees
Residue
iResidue
i+1Distance of hinge axis to residue i in
(A) Distance of hinge axis to residue i in
(A) Change in
(deg) Change in
(deg) Angle of psi(i) axis to hinge axis
(deg) Angle of psi(i) axis to hinge axis
(deg) Percentage Progress
ASP-337
LEU-338
15.6
15.4
14.8
-9.5
81.4
81.8
112.9
LEU-338
ALA-339
14.1
14.0
-12.8
10.2
166.1
165.4
-56.2
ALA-339
LYS-340
14.2
13.9
16.0
-10.4
81.2
79.5
24.0
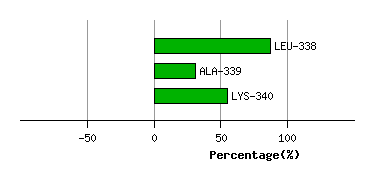
Graph shows rotational transition at bending residues and can be used
to identify hinge bending residues.
Probably only informative for interdomain rotations greater than 20 degrees
Residue
iResidue
i+1Distance of hinge axis to residue i in
(A) Distance of hinge axis to residue i in
(A) Change in
(deg) Change in
(deg) Angle of psi(i) axis to hinge axis
(deg) Angle of psi(i) axis to hinge axis
(deg) Percentage Progress
PHE-347
LYS-348
11.9
11.8
20.9
-12.2
98.1
103.9
-102.8
LYS-348
VAL-349
9.7
9.4
-3.9
-4.9
117.3
116.4
-41.7
VAL-349
HIS-350
7.4
7.2
19.6
-27.8
131.0
127.4
175.3
HIS-350
CYS-351
6.0
5.6
-60.2
63.5
117.4
125.4
24.4
CYS-351
ASN-352
5.9
6.2
-21.7
17.3
146.2
145.6
-123.1
CYS-351
ASN-352
5.9
6.2
-21.7
17.3
146.2
145.6
-123.1
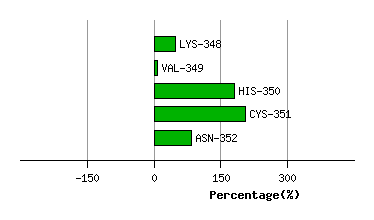
Graph shows rotational transition at bending residues and can be used
to identify hinge bending residues.
Probably only informative for interdomain rotations greater than 20 degrees
Residue
iResidue
i+1Distance of hinge axis to residue i in
(A) Distance of hinge axis to residue i in
(A) Change in
(deg) Change in
(deg) Angle of psi(i) axis to hinge axis
(deg) Angle of psi(i) axis to hinge axis
(deg) Percentage Progress
CYS-351
ASN-352
5.9
6.2
-21.7
17.3
146.2
145.6
-123.1
CYS-351
ASN-352
5.9
6.2
-21.7
17.3
146.2
145.6
-123.1
ASN-352
ALA-353
5.7
5.8
7.8
-8.7
93.2
94.7
4.3
ALA-353
PHE-354
7.0
7.2
0.6
0.7
19.6
23.4
37.8
PHE-354
ASN-355
8.9
9.1
-9.5
6.4
134.0
132.5
-23.5
ASN-355
THR-356
6.5
6.5
-2.6
5.0
79.2
76.5
-72.9
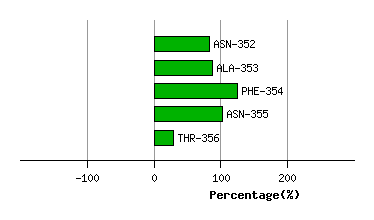
Graph shows rotational transition at bending residues and can be used
to identify hinge bending residues.
Probably only informative for interdomain rotations greater than 20 degrees