Rac-Beta Serine/threonine Protein Kinase
(All numbering and residues are taken from first PDB file)
![]()
![]()
Bending Residue Dihedral Analysis
Residue
iResidue
i+1Distance of hinge axis to residue i in
(A) Distance of hinge axis to residue i in
(A) Change in
(deg) Change in
(deg) Angle of psi(i) axis to hinge axis
(deg) Angle of psi(i) axis to hinge axis
(deg) Percentage Progress
ILE-289
LYS-290
3.4
2.7
-1.4
-2.4
100.5
108.9
-0.8
LYS-290
ILE-291
5.2
5.2
-3.4
2.4
20.9
24.4
-2.6
ILE-291
THR-292
5.7
6.2
15.5
-33.3
86.9
83.5
29.1
THR-292
ASP-293
9.4
9.8
12.1
179.7
134.6
151.3
-386.1
ASP-293
PHE-294
12.0
12.4
20.3
101.9
122.0
104.3
706.6
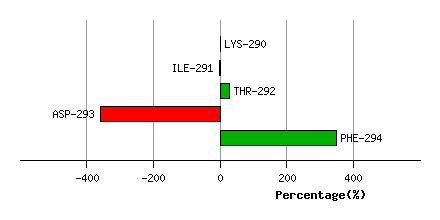
Graph shows rotational transition at bending residues and can be used
to identify hinge bending residues.
Probably only informative for interdomain rotations greater than 20 degrees
Residue
iResidue
i+1Distance of hinge axis to residue i in
(A) Distance of hinge axis to residue i in
(A) Change in
(deg) Change in
(deg) Angle of psi(i) axis to hinge axis
(deg) Angle of psi(i) axis to hinge axis
(deg) Percentage Progress
TYR-316
LEU-317
3.8
3.7
-73.5
1.8
75.3
105.0
-6.3
LEU-317
ALA-318
6.0
6.0
-18.4
-3.8
103.7
105.9
2.6
ALA-318
PRO-319
6.5
6.9
7.3
-7.2
26.9
19.9
3.6
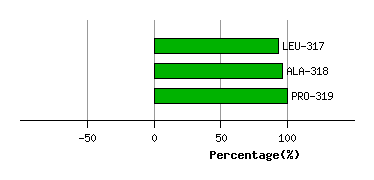
Graph shows rotational transition at bending residues and can be used
to identify hinge bending residues.
Probably only informative for interdomain rotations greater than 20 degrees
Residue
iResidue
i+1Distance of hinge axis to residue i in
(A) Distance of hinge axis to residue i in
(A) Change in
(deg) Change in
(deg) Angle of psi(i) axis to hinge axis
(deg) Angle of psi(i) axis to hinge axis
(deg) Percentage Progress
CYS-345
GLY-346
12.4
12.0
24.2
-20.0
91.4
102.4
-12.9
GLY-346
ARG-347
12.5
12.2
12.6
-6.6
135.0
136.5
-9.2
ARG-347
LEU-348
10.8
9.9
7.1
-1.1
103.2
94.2
-9.9
LEU-348
PRO-349
7.2
6.3
-19.7
-2.7
43.0
48.4
46.4
PRO-349
PHE-350
6.5
5.5
-0.1
-16.9
22.2
19.8
47.3
PHE-350
TYR-351
6.6
3.9
96.8
-103.1
85.3
85.5
7.3
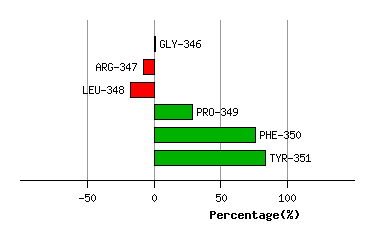
Graph shows rotational transition at bending residues and can be used
to identify hinge bending residues.
Probably only informative for interdomain rotations greater than 20 degrees
Residue
iResidue
i+1Distance of hinge axis to residue i in
(A) Distance of hinge axis to residue i in
(A) Change in
(deg) Change in
(deg) Angle of psi(i) axis to hinge axis
(deg) Angle of psi(i) axis to hinge axis
(deg) Percentage Progress
PHE-359
GLU-360
4.7
4.6
17.9
9.4
65.4
54.6
22.5
GLU-360
LEU-361
2.4
2.5
-10.5
3.3
62.0
64.3
5.0
LEU-361
ILE-362
1.0
0.7
6.3
-1.9
139.2
135.9
-6.0
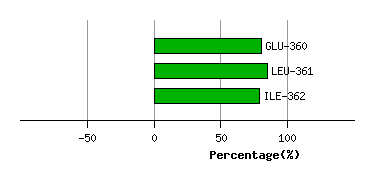
Graph shows rotational transition at bending residues and can be used
to identify hinge bending residues.
Probably only informative for interdomain rotations greater than 20 degrees