Elongation Factor Tu
(All numbering and residues are taken from first PDB file)
![]()
![]()
Bending Residue Dihedral Analysis
Residue
iResidue
i+1Distance of hinge axis to residue i in
(A) Distance of hinge axis to residue i in
(A) Change in
(deg) Change in
(deg) Angle of psi(i) axis to hinge axis
(deg) Angle of psi(i) axis to hinge axis
(deg) Percentage Progress
HIS-79
VAL-80
13.9
12.8
-2.3
4.1
65.9
92.0
-63.6
VAL-80
ASP-81
16.4
16.3
-11.1
-16.6
96.3
95.6
-84.5
ASP-81
CYS-82
20.0
19.6
-14.1
3.4
36.4
89.6
83.3
CYS-82
PRO-83
22.2
23.1
62.6
16.0
80.4
80.0
83.1
PRO-83
GLY-84
25.9
26.4
-8.6
7.5
35.2
45.1
3.7
GLY-84
HIS-85
27.0
28.5
13.6
16.4
144.8
158.7
-193.2
HIS-85
ALA-86
26.0
28.4
24.7
-4.1
110.3
124.0
-109.2
ALA-86
ASP-87
27.3
29.0
-6.1
14.9
125.6
100.1
0.6
ASP-87
TYR-88
26.2
26.2
-11.7
4.4
87.7
57.9
54.8
TYR-88
ILE-89
22.6
23.8
1.0
-3.7
142.3
159.6
-52.8
ILE-89
LYS-90
22.5
25.0
-10.0
2.2
98.7
86.6
38.9
LYS-90
ASN-91
24.3
25.0
-17.6
30.8
122.1
100.9
17.1
ASN-91
MET-92
21.7
21.6
-29.8
8.8
59.1
42.8
64.4
MET-92
ILE-93
18.9
19.6
1.0
-4.5
127.7
145.2
2.4
ILE-93
THR-94
20.6
21.0
-0.5
-1.1
119.6
92.9
-20.2
THR-94
GLY-95
22.0
21.4
-42.7
5.4
120.4
108.4
-97.6
GLY-95
ALA-96
18.3
17.9
52.8
7.2
23.0
37.0
424.4
ALA-96
ALA-97
18.5
19.0
18.7
-53.4
87.5
67.1
-121.0
ALA-97
GLN-98
16.7
15.7
-28.5
73.9
51.4
45.6
-241.9
GLN-98
MET-99
13.3
13.2
53.6
-8.2
74.3
73.0
114.1
MET-99
ASP-100
12.5
12.2
18.4
-10.7
120.5
120.1
-37.0
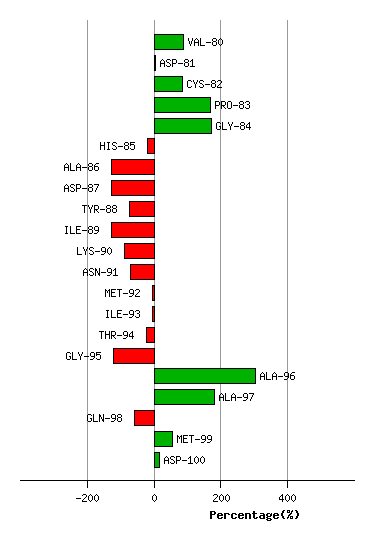
Graph shows rotational transition at bending residues and can be used
to identify hinge bending residues.
Probably only informative for interdomain rotations greater than 20 degrees
Residue
iResidue
i+1Distance of hinge axis to residue i in
(A) Distance of hinge axis to residue i in
(A) Change in
(deg) Change in
(deg) Angle of psi(i) axis to hinge axis
(deg) Angle of psi(i) axis to hinge axis
(deg) Percentage Progress
THR-212
PRO-213
3.0
3.6
-8.1
-17.6
41.9
40.3
138.1
PRO-213
VAL-214
2.4
2.0
34.4
-27.7
97.6
102.3
52.5
VAL-214
ARG-215
2.2
2.3
1.5
-9.3
65.5
62.0
-53.9
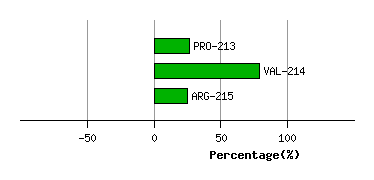
Graph shows rotational transition at bending residues and can be used
to identify hinge bending residues.
Probably only informative for interdomain rotations greater than 20 degrees