Hla Class I Histocompatibility Antigen
(All numbering and residues are taken from first PDB file)
![]()
![]()
Bending Residue Dihedral Analysis
Residue
iResidue
i+1Distance of hinge axis to residue i in
(A) Distance of hinge axis to residue i in
(A) Change in
(deg) Change in
(deg) Angle of psi(i) axis to hinge axis
(deg) Angle of psi(i) axis to hinge axis
(deg) Percentage Progress
ALA-193
VAL-194
21.4
21.7
28.6
-30.9
66.0
70.9
7.6
VAL-194
SER-195
24.0
24.5
11.2
-2.0
70.8
76.3
65.2
SER-195
ASP-196
26.3
27.1
-2.3
5.6
73.6
80.3
5.5
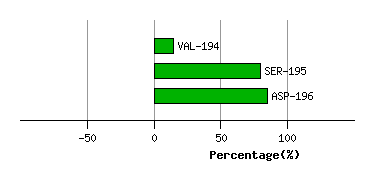
Graph shows rotational transition at bending residues and can be used
to identify hinge bending residues.
Probably only informative for interdomain rotations greater than 20 degrees
Residue
iResidue
i+1Distance of hinge axis to residue i in
(A) Distance of hinge axis to residue i in
(A) Change in
(deg) Change in
(deg) Angle of psi(i) axis to hinge axis
(deg) Angle of psi(i) axis to hinge axis
(deg) Percentage Progress
ALA-199
THR-200
21.8
22.3
8.0
-6.9
61.4
62.5
60.5
THR-200
LEU-201
20.2
20.4
6.2
1.5
72.6
76.6
-25.4
LEU-201
ARG-202
17.2
17.2
8.5
-7.9
83.3
84.1
34.4
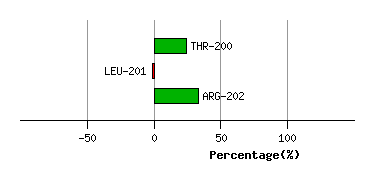
Graph shows rotational transition at bending residues and can be used
to identify hinge bending residues.
Probably only informative for interdomain rotations greater than 20 degrees
Residue
iResidue
i+1Distance of hinge axis to residue i in
(A) Distance of hinge axis to residue i in
(A) Change in
(deg) Change in
(deg) Angle of psi(i) axis to hinge axis
(deg) Angle of psi(i) axis to hinge axis
(deg) Percentage Progress
ILE-213
THR-214
16.7
16.8
6.4
-13.4
106.4
108.5
25.4
THR-214
LEU-215
16.5
16.7
7.7
12.6
55.9
67.6
6.5
LEU-215
THR-216
15.9
15.8
9.2
6.1
99.0
112.1
-27.8
THR-216
TRP-217
17.2
17.0
-33.2
26.9
102.0
103.4
3.2
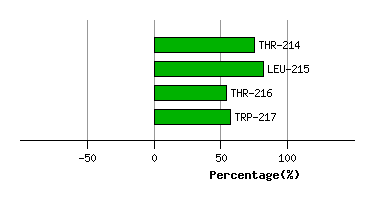
Graph shows rotational transition at bending residues and can be used
to identify hinge bending residues.
Probably only informative for interdomain rotations greater than 20 degrees
Residue
iResidue
i+1Distance of hinge axis to residue i in
(A) Distance of hinge axis to residue i in
(A) Change in
(deg) Change in
(deg) Angle of psi(i) axis to hinge axis
(deg) Angle of psi(i) axis to hinge axis
(deg) Percentage Progress
ASP-227
THR-228
25.7
26.5
21.9
-7.5
121.0
103.9
-118.5
THR-228
GLU-229
22.9
23.7
32.7
-60.2
123.9
123.1
150.4
GLU-229
LEU-230
23.4
23.6
50.5
-43.7
78.5
87.6
3.2
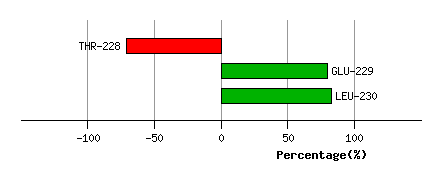
Graph shows rotational transition at bending residues and can be used
to identify hinge bending residues.
Probably only informative for interdomain rotations greater than 20 degrees
Residue
iResidue
i+1Distance of hinge axis to residue i in
(A) Distance of hinge axis to residue i in
(A) Change in
(deg) Change in
(deg) Angle of psi(i) axis to hinge axis
(deg) Angle of psi(i) axis to hinge axis
(deg) Percentage Progress
VAL-247
VAL-248
21.2
21.2
2.3
-6.0
46.0
50.7
-82.3
VAL-248
VAL-249
23.4
23.5
17.6
-34.2
126.3
129.8
100.8
VAL-249
PRO-250
22.8
23.8
29.4
-5.1
65.3
61.6
109.6
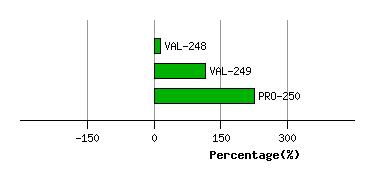
Graph shows rotational transition at bending residues and can be used
to identify hinge bending residues.
Probably only informative for interdomain rotations greater than 20 degrees
Residue
iResidue
i+1Distance of hinge axis to residue i in
(A) Distance of hinge axis to residue i in
(A) Change in
(deg) Change in
(deg) Angle of psi(i) axis to hinge axis
(deg) Angle of psi(i) axis to hinge axis
(deg) Percentage Progress
VAL-261
GLN-262
11.4
11.3
-3.7
6.5
139.7
137.4
11.6
GLN-262
HIS-263
12.2
12.2
2.9
3.1
116.3
117.4
-24.2
HIS-263
GLU-264
12.9
13.0
3.7
-10.5
59.4
55.1
-92.7
GLU-264
GLY-265
13.5
14.0
16.9
-19.0
115.0
107.3
78.7
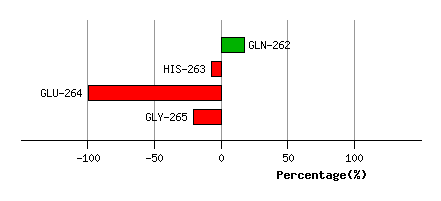
Graph shows rotational transition at bending residues and can be used
to identify hinge bending residues.
Probably only informative for interdomain rotations greater than 20 degrees
Residue
iResidue
i+1Distance of hinge axis to residue i in
(A) Distance of hinge axis to residue i in
(A) Change in
(deg) Change in
(deg) Angle of psi(i) axis to hinge axis
(deg) Angle of psi(i) axis to hinge axis
(deg) Percentage Progress
LEU-266
PRO-267
8.5
8.8
13.4
-6.6
9.2
9.9
79.1
PRO-267
LYS-268
7.6
7.7
8.7
-23.0
62.1
62.9
-0.2
LYS-268
PRO-269
5.7
6.0
13.4
-5.6
130.1
140.0
-48.9
PRO-269
LEU-270
8.1
7.8
3.4
-4.7
125.4
120.1
11.7
LEU-270
THR-271
7.2
6.6
5.8
10.4
91.7
85.8
21.6
LEU-270
THR-271
7.2
6.6
5.8
10.4
91.7
85.8
21.6
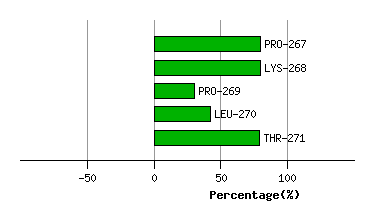
Graph shows rotational transition at bending residues and can be used
to identify hinge bending residues.
Probably only informative for interdomain rotations greater than 20 degrees
Residue
iResidue
i+1Distance of hinge axis to residue i in
(A) Distance of hinge axis to residue i in
(A) Change in
(deg) Change in
(deg) Angle of psi(i) axis to hinge axis
(deg) Angle of psi(i) axis to hinge axis
(deg) Percentage Progress
LEU-270
THR-271
7.2
6.6
5.8
10.4
91.7
85.8
21.6
LEU-270
THR-271
7.2
6.6
5.8
10.4
91.7
85.8
21.6
THR-271
LEU-272
9.0
8.4
18.0
-13.5
38.9
32.3
1.0
LEU-272
ARG-273
9.4
9.2
2.4
2.5
86.1
85.8
32.5
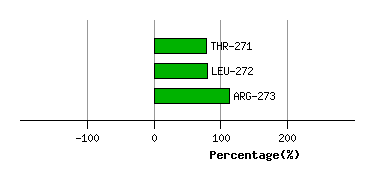
Graph shows rotational transition at bending residues and can be used
to identify hinge bending residues.
Probably only informative for interdomain rotations greater than 20 degrees