Pyruvate Decarboxylase (Pdc) (E.C.4.1.1.1)
(All numbering and residues are taken from first PDB file)
![]()
![]()
Bending Residue Dihedral Analysis
Residue
iResidue
i+1Distance of hinge axis to residue i in
(A) Distance of hinge axis to residue i in
(A) Change in
(deg) Change in
(deg) Angle of psi(i) axis to hinge axis
(deg) Angle of psi(i) axis to hinge axis
(deg) Percentage Progress
LEU-189
LYS-190
2.8
2.6
-5.7
5.6
49.0
60.6
-75.1
LYS-190
PRO-191
1.8
2.3
14.6
-6.5
49.6
50.1
75.5
PRO-191
ASN-192
5.1
5.5
-16.6
18.0
101.3
94.0
-3.6
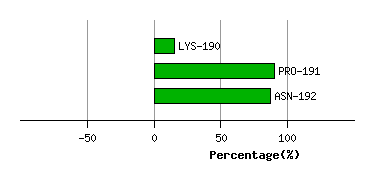
Graph shows rotational transition at bending residues and can be used
to identify hinge bending residues.
Probably only informative for interdomain rotations greater than 20 degrees
Residue
iResidue
i+1Distance of hinge axis to residue i in
(A) Distance of hinge axis to residue i in
(A) Change in
(deg) Change in
(deg) Angle of psi(i) axis to hinge axis
(deg) Angle of psi(i) axis to hinge axis
(deg) Percentage Progress
VAL-215
ILE-216
6.4
6.5
5.7
4.5
26.4
29.9
126.3
ILE-216
LEU-217
3.9
3.9
-8.9
11.0
77.9
78.8
36.5
LEU-217
ALA-218
2.1
2.3
3.5
7.2
31.5
38.3
70.8
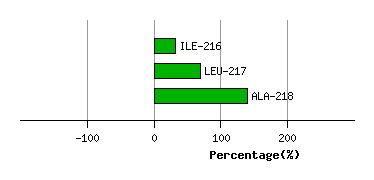
Graph shows rotational transition at bending residues and can be used
to identify hinge bending residues.
Probably only informative for interdomain rotations greater than 20 degrees
Residue
iResidue
i+1Distance of hinge axis to residue i in
(A) Distance of hinge axis to residue i in
(A) Change in
(deg) Change in
(deg) Angle of psi(i) axis to hinge axis
(deg) Angle of psi(i) axis to hinge axis
(deg) Percentage Progress
ALA-220
CYS-221
8.4
8.4
32.3
-28.6
144.9
148.6
-137.8
CYS-221
CYS-222
6.5
6.4
30.9
-28.7
88.1
89.3
64.8
CYS-222
SER-223
4.1
4.4
11.5
8.6
104.4
94.3
10.3
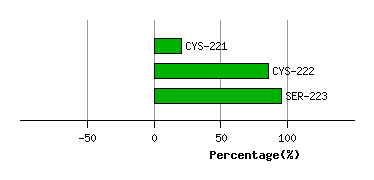
Graph shows rotational transition at bending residues and can be used
to identify hinge bending residues.
Probably only informative for interdomain rotations greater than 20 degrees
Residue
iResidue
i+1Distance of hinge axis to residue i in
(A) Distance of hinge axis to residue i in
(A) Change in
(deg) Change in
(deg) Angle of psi(i) axis to hinge axis
(deg) Angle of psi(i) axis to hinge axis
(deg) Percentage Progress
PRO-241
ALA-242
5.7
5.7
0.8
8.0
40.6
47.6
59.6
ALA-242
PHE-243
3.1
2.9
12.7
-12.8
112.4
118.4
27.2
PHE-243
VAL-244
1.1
1.0
1.0
6.4
39.4
39.4
24.8
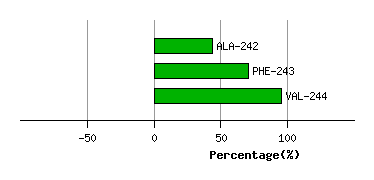
Graph shows rotational transition at bending residues and can be used
to identify hinge bending residues.
Probably only informative for interdomain rotations greater than 20 degrees
Residue
iResidue
i+1Distance of hinge axis to residue i in
(A) Distance of hinge axis to residue i in
(A) Change in
(deg) Change in
(deg) Angle of psi(i) axis to hinge axis
(deg) Angle of psi(i) axis to hinge axis
(deg) Percentage Progress
SER-251
ILE-252
7.8
8.4
19.4
2.6
72.7
67.0
-2.0
ILE-252
SER-253
7.5
7.4
-3.2
4.1
129.2
133.4
42.7
SER-253
GLU-254
10.6
10.3
-8.0
0.7
160.6
158.9
-58.5
GLU-254
GLN-255
10.0
9.5
10.3
0.5
43.0
46.5
3.6
GLN-255
HIS-256
12.3
11.8
-22.1
13.1
76.7
83.8
9.6
HIS-256
PRO-257
11.0
10.6
18.5
-7.3
33.5
37.7
33.6
PRO-257
ARG-258
11.0
10.3
-25.1
23.1
81.4
89.7
-33.9
ARG-258
TYR-259
8.1
7.5
-5.0
0.6
80.6
86.3
16.6
TYR-259
GLY-260
5.8
5.2
-0.9
-1.3
145.4
145.3
-16.5
GLY-260
GLY-261
2.8
2.2
-12.7
5.8
101.6
103.0
-24.2
GLY-261
VAL-262
4.2
4.1
-10.0
5.3
43.1
45.6
-3.6
VAL-262
TYR-263
6.1
6.4
19.3
-6.5
75.1
76.7
40.2
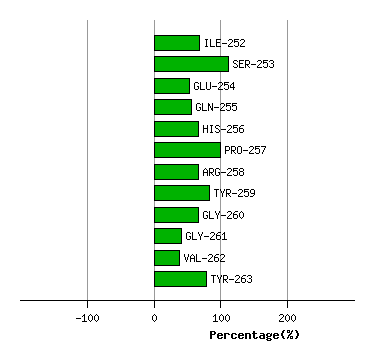
Graph shows rotational transition at bending residues and can be used
to identify hinge bending residues.
Probably only informative for interdomain rotations greater than 20 degrees
Residue
iResidue
i+1Distance of hinge axis to residue i in
(A) Distance of hinge axis to residue i in
(A) Change in
(deg) Change in
(deg) Angle of psi(i) axis to hinge axis
(deg) Angle of psi(i) axis to hinge axis
(deg) Percentage Progress
LYS-273
GLU-274
7.2
7.8
8.7
-13.1
96.6
95.5
-7.6
GLU-274
ALA-275
7.4
8.1
13.6
3.2
52.7
53.5
123.4
ALA-275
VAL-276
5.7
5.9
-12.4
7.7
159.7
157.5
-64.1
VAL-276
GLU-277
6.5
6.8
1.3
2.2
91.8
94.4
17.4
VAL-276
GLU-277
6.5
6.8
1.3
2.2
91.8
94.4
17.4
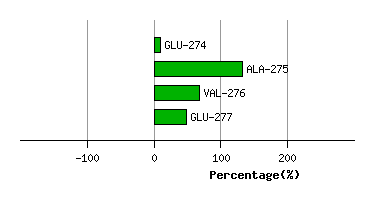
Graph shows rotational transition at bending residues and can be used
to identify hinge bending residues.
Probably only informative for interdomain rotations greater than 20 degrees
Residue
iResidue
i+1Distance of hinge axis to residue i in
(A) Distance of hinge axis to residue i in
(A) Change in
(deg) Change in
(deg) Angle of psi(i) axis to hinge axis
(deg) Angle of psi(i) axis to hinge axis
(deg) Percentage Progress
VAL-276
GLU-277
6.5
6.8
1.3
2.2
91.8
94.4
17.4
VAL-276
GLU-277
6.5
6.8
1.3
2.2
91.8
94.4
17.4
GLU-277
SER-278
10.1
10.5
-3.1
-14.3
102.0
101.7
65.2
SER-278
ALA-279
10.7
11.2
33.9
-21.5
139.1
139.5
-66.1
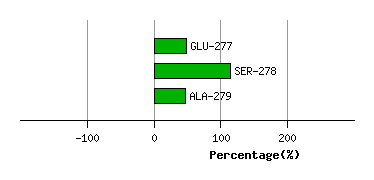
Graph shows rotational transition at bending residues and can be used
to identify hinge bending residues.
Probably only informative for interdomain rotations greater than 20 degrees
Residue
iResidue
i+1Distance of hinge axis to residue i in
(A) Distance of hinge axis to residue i in
(A) Change in
(deg) Change in
(deg) Angle of psi(i) axis to hinge axis
(deg) Angle of psi(i) axis to hinge axis
(deg) Percentage Progress
GLY-286
ALA-287
5.3
3.8
-155.5
85.3
138.1
64.3
373.4
ALA-287
LEU-288
8.4
6.9
-73.1
-102.2
90.3
114.8
-673.1
LEU-288
LEU-289
12.0
10.2
135.0
33.7
133.8
130.3
1340.4
LEU-289
SER-290
14.5
12.0
93.6
-95.6
118.0
102.8
169.2
SER-290
ASP-291
15.8
13.7
174.3
147.3
136.3
128.5
-2047.3
LYS-302
THR-303
12.6
14.3
35.0
-148.9
51.9
51.6
-559.2
THR-303
LYS-304
15.8
14.9
-19.2
-15.2
151.9
158.9
-324.0
LYS-304
ASN-305
17.0
16.1
4.5
3.8
56.4
54.2
123.9
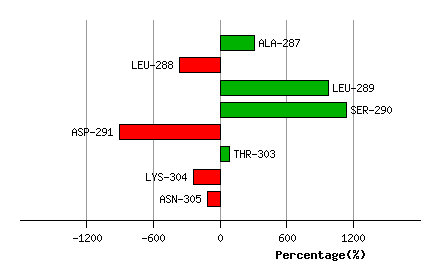
Graph shows rotational transition at bending residues and can be used
to identify hinge bending residues.
Probably only informative for interdomain rotations greater than 20 degrees
Residue
iResidue
i+1Distance of hinge axis to residue i in
(A) Distance of hinge axis to residue i in
(A) Change in
(deg) Change in
(deg) Angle of psi(i) axis to hinge axis
(deg) Angle of psi(i) axis to hinge axis
(deg) Percentage Progress
VAL-349
PRO-350
5.1
4.8
3.2
-0.3
139.7
137.3
-34.0
PRO-350
ALA-351
2.3
2.2
14.8
-22.8
96.8
93.6
29.7
ALA-351
ARG-352
4.9
5.0
4.1
9.0
71.9
80.7
-2.2
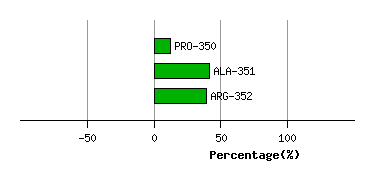
Graph shows rotational transition at bending residues and can be used
to identify hinge bending residues.
Probably only informative for interdomain rotations greater than 20 degrees