Phosphonoacetaldehyde Hydrolase
(All numbering and residues are taken from first PDB file)
![]()
![]()
Bending Residue Dihedral Analysis
Residue
iResidue
i+1Distance of hinge axis to residue i in
(A) Distance of hinge axis to residue i in
(A) Change in
(deg) Change in
(deg) Angle of psi(i) axis to hinge axis
(deg) Angle of psi(i) axis to hinge axis
(deg) Percentage Progress
ALA-24
PRO-25
4.7
4.5
3.4
-8.4
85.3
77.9
20.5
PRO-25
LEU-26
2.0
1.5
-27.0
37.1
132.8
137.4
63.0
LEU-26
GLU-27
1.3
1.2
38.3
-51.8
111.2
103.4
24.7
GLU-27
VAL-28
4.7
4.0
5.8
-3.0
123.9
121.7
-0.4
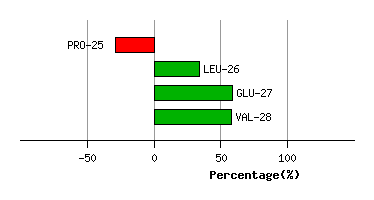
Graph shows rotational transition at bending residues and can be used
to identify hinge bending residues.
Probably only informative for interdomain rotations greater than 20 degrees
Residue
iResidue
i+1Distance of hinge axis to residue i in
(A) Distance of hinge axis to residue i in
(A) Change in
(deg) Change in
(deg) Angle of psi(i) axis to hinge axis
(deg) Angle of psi(i) axis to hinge axis
(deg) Percentage Progress
ALA-45
ARG-46
2.1
2.9
-6.9
3.6
97.9
96.6
-17.6
ARG-46
LYS-47
3.1
2.6
59.2
-79.7
105.4
119.2
127.1
LYS-47
PRO-48
6.1
4.7
42.5
-0.3
44.9
68.4
152.9
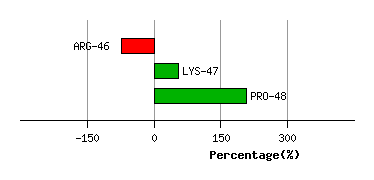
Graph shows rotational transition at bending residues and can be used
to identify hinge bending residues.
Probably only informative for interdomain rotations greater than 20 degrees
Residue
iResidue
i+1Distance of hinge axis to residue i in
(A) Distance of hinge axis to residue i in
(A) Change in
(deg) Change in
(deg) Angle of psi(i) axis to hinge axis
(deg) Angle of psi(i) axis to hinge axis
(deg) Percentage Progress
MET-49
PRO-50
6.9
8.1
-147.3
111.6
49.4
47.3
217.9
PRO-50
LEU-51
10.3
10.1
88.1
-16.0
110.5
117.0
-103.7
LEU-51
LEU-52
11.4
12.3
95.1
7.4
95.9
164.8
-346.6
LEU-52
LYS-53
8.3
12.3
116.1
31.0
121.8
92.2
393.0
LYS-53
ILE-54
10.6
9.0
137.0
-19.2
63.8
86.8
257.9
ILE-54
ASP-55
11.8
11.8
-11.8
1.6
170.8
160.5
-56.8
ASP-55
HIS-56
13.0
13.3
-98.2
109.0
117.0
132.6
-19.3
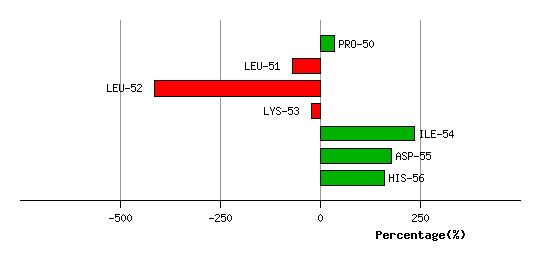
Graph shows rotational transition at bending residues and can be used
to identify hinge bending residues.
Probably only informative for interdomain rotations greater than 20 degrees
Residue
iResidue
i+1Distance of hinge axis to residue i in
(A) Distance of hinge axis to residue i in
(A) Change in
(deg) Change in
(deg) Angle of psi(i) axis to hinge axis
(deg) Angle of psi(i) axis to hinge axis
(deg) Percentage Progress
ILE-93
LEU-94
4.5
4.3
1.2
-4.2
104.2
99.6
5.5
LEU-94
PHE-95
0.9
0.6
0.2
4.4
38.4
32.3
30.7
PHE-95
ALA-96
0.9
0.5
-15.5
27.0
109.2
102.6
-2.7
ALA-96
ILE-97
3.6
3.7
-26.6
-5.2
46.5
57.2
82.2
ILE-97
LEU-98
5.1
5.2
32.7
-20.7
102.5
106.5
-10.3
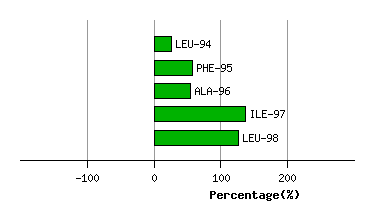
Graph shows rotational transition at bending residues and can be used
to identify hinge bending residues.
Probably only informative for interdomain rotations greater than 20 degrees