Elongation Factor Tu
(All numbering and residues are taken from first PDB file)
![]()
![]()
Bending Residue Dihedral Analysis
Residue
iResidue
i+1Distance of hinge axis to residue i in
(A) Distance of hinge axis to residue i in
(A) Change in
(deg) Change in
(deg) Angle of psi(i) axis to hinge axis
(deg) Angle of psi(i) axis to hinge axis
(deg) Percentage Progress
ASP-81
CYS-82
23.5
22.5
22.1
-26.4
10.3
18.6
-4.7
CYS-82
PRO-83
23.1
22.2
-59.9
-7.4
123.0
127.5
-24.3
PRO-83
GLY-84
25.6
24.8
173.2
-25.5
59.5
19.7
140.9
GLY-84
HIS-85
27.1
22.5
171.4
-19.3
11.1
89.3
96.3
HIS-85
ALA-86
28.2
20.0
164.4
-2.4
55.2
73.6
-221.2
ALA-86
ASP-87
26.2
18.0
-3.2
-10.4
103.3
47.8
0.4
ASP-87
TYR-88
25.8
18.7
-17.5
57.6
53.3
38.2
-12.6
TYR-88
ILE-89
23.8
17.1
-67.7
-3.0
65.2
104.2
-11.8
ILE-89
LYS-90
21.1
13.9
-1.3
-22.3
77.5
88.0
-6.5
LYS-90
ASN-91
18.4
13.8
16.2
-20.1
165.2
156.2
6.1
ASN-91
MET-92
19.7
14.2
27.6
-23.1
123.3
113.6
-7.4
MET-92
ILE-93
20.0
11.6
29.7
-39.9
93.1
73.0
-4.1
ILE-93
THR-94
16.6
9.3
17.9
-41.0
130.8
111.6
12.6
THR-94
GLY-95
14.9
11.2
101.9
90.2
161.8
175.0
161.2
GLY-95
ALA-96
16.3
9.7
67.7
-11.6
102.0
131.0
-26.5
ALA-96
ALA-97
15.6
13.1
-79.5
29.5
94.1
62.1
16.9
ALA-97
GLN-98
11.9
13.6
-156.7
-77.4
28.9
74.3
-73.8
GLN-98
MET-99
11.5
11.7
23.4
84.9
139.2
126.0
-68.8
MET-99
ASP-100
13.1
14.4
-69.3
84.7
91.4
68.0
0.6
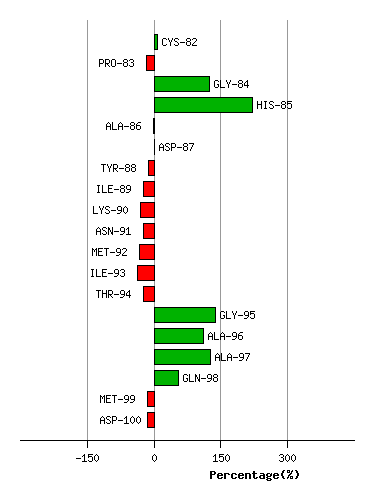
Graph shows rotational transition at bending residues and can be used
to identify hinge bending residues.
Probably only informative for interdomain rotations greater than 20 degrees
Residue
iResidue
i+1Distance of hinge axis to residue i in
(A) Distance of hinge axis to residue i in
(A) Change in
(deg) Change in
(deg) Angle of psi(i) axis to hinge axis
(deg) Angle of psi(i) axis to hinge axis
(deg) Percentage Progress
PRO-213
VAL-214
9.6
9.1
92.4
2.2
98.4
119.1
-30.8
VAL-214
ARG-215
6.7
6.9
-11.7
88.7
136.2
88.9
47.7
ARG-215
ASP-216
3.3
3.4
-69.0
124.6
72.4
124.6
49.3
ASP-216
VAL-217
0.6
0.6
-173.4
38.8
104.7
66.9
5.0
VAL-217
ASP-218
4.0
3.1
-44.0
1.5
90.2
84.3
-0.7
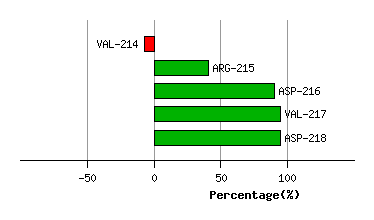
Graph shows rotational transition at bending residues and can be used
to identify hinge bending residues.
Probably only informative for interdomain rotations greater than 20 degrees