72 Kda Type IV Collagenase
(All numbering and residues are taken from first PDB file)
![]()
![]()
Bending Residue Dihedral Analysis
Residue
iResidue
i+1Distance of hinge axis to residue i in
(A) Distance of hinge axis to residue i in
(A) Change in
(deg) Change in
(deg) Angle of psi(i) axis to hinge axis
(deg) Angle of psi(i) axis to hinge axis
(deg) Percentage Progress
GLU-438
ILE-439
5.6
5.8
-11.9
-58.9
136.4
155.3
-343.2
ILE-439
CYS-440
7.4
6.6
36.7
40.3
12.1
49.8
396.5
CYS-440
LYS-441
8.3
9.8
5.2
-71.6
80.3
73.5
-63.0
LYS-441
GLN-442
9.4
9.9
56.4
-31.9
51.3
64.3
100.6
GLN-442
ASP-443
6.7
6.7
-26.1
-23.3
118.7
125.5
-162.4
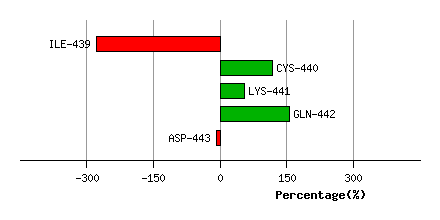
Graph shows rotational transition at bending residues and can be used
to identify hinge bending residues.
Probably only informative for interdomain rotations greater than 20 degrees
Residue
iResidue
i+1Distance of hinge axis to residue i in
(A) Distance of hinge axis to residue i in
(A) Change in
(deg) Change in
(deg) Angle of psi(i) axis to hinge axis
(deg) Angle of psi(i) axis to hinge axis
(deg) Percentage Progress
THR-467
VAL-468
16.4
16.7
-7.2
-10.9
67.3
77.0
60.8
VAL-468
THR-469
20.0
20.4
82.3
-59.5
159.9
153.3
-143.1
THR-469
PRO-470
21.3
20.7
172.5
-28.7
106.9
115.9
-208.9
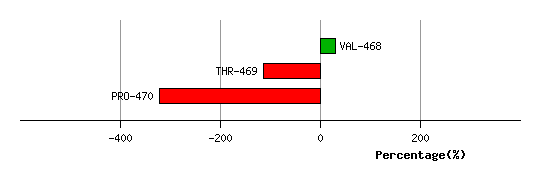
Graph shows rotational transition at bending residues and can be used
to identify hinge bending residues.
Probably only informative for interdomain rotations greater than 20 degrees
Residue
iResidue
i+1Distance of hinge axis to residue i in
(A) Distance of hinge axis to residue i in
(A) Change in
(deg) Change in
(deg) Angle of psi(i) axis to hinge axis
(deg) Angle of psi(i) axis to hinge axis
(deg) Percentage Progress
LYS-473
PRO-474
15.3
16.1
24.0
-11.0
131.4
118.4
-4.0
PRO-474
MET-475
13.6
13.6
-52.5
39.7
24.2
17.5
51.0
MET-475
GLY-476
12.6
13.2
-55.9
27.2
81.8
83.3
19.3
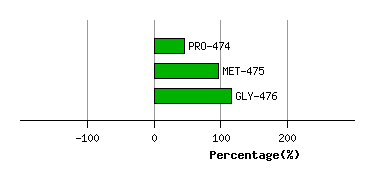
Graph shows rotational transition at bending residues and can be used
to identify hinge bending residues.
Probably only informative for interdomain rotations greater than 20 degrees