Ras-Related Protein Rab-6a
(All numbering and residues are taken from first PDB file)
![]()
![]()
Bending Residue Dihedral Analysis
Residue
iResidue
i+1Distance of hinge axis to residue i in
(A) Distance of hinge axis to residue i in
(A) Change in
(deg) Change in
(deg) Angle of psi(i) axis to hinge axis
(deg) Angle of psi(i) axis to hinge axis
(deg) Percentage Progress
GLY-20
GLU-21
1.1
0.9
-13.2
4.9
138.0
131.1
-107.6
GLU-21
GLN-22
3.1
3.0
9.4
-1.9
45.8
44.7
36.3
GLN-22
SER-23
3.0
3.1
5.0
-6.2
46.3
48.5
16.1
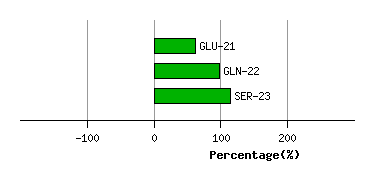
Graph shows rotational transition at bending residues and can be used
to identify hinge bending residues.
Probably only informative for interdomain rotations greater than 20 degrees
Residue
iResidue
i+1Distance of hinge axis to residue i in
(A) Distance of hinge axis to residue i in
(A) Change in
(deg) Change in
(deg) Angle of psi(i) axis to hinge axis
(deg) Angle of psi(i) axis to hinge axis
(deg) Percentage Progress
ASP-39
ASN-40
12.3
12.2
-9.4
-13.4
83.5
82.9
15.0
ASN-40
THR-41
8.9
9.1
16.1
-10.6
83.0
96.2
-12.9
THR-41
TYR-42
8.8
8.3
19.7
-17.7
26.3
29.2
23.9
TYR-42
GLN-43
7.0
6.6
10.7
-23.3
71.8
78.5
-3.8
GLN-43
ALA-44
9.7
9.3
16.9
-10.0
34.1
22.5
53.4
ALA-44
THR-45
8.3
8.4
6.6
-7.5
41.3
45.9
-37.7
THR-45
ILE-46
9.6
9.9
1.3
-11.5
76.6
71.6
-54.0
ILE-46
GLY-47
12.4
12.4
-101.0
134.4
166.1
151.5
319.1
GLY-47
ILE-48
12.5
13.4
-29.6
4.4
114.8
121.7
-106.4
ILE-48
ASP-49
11.6
12.3
-14.0
0.7
76.9
88.0
-17.2
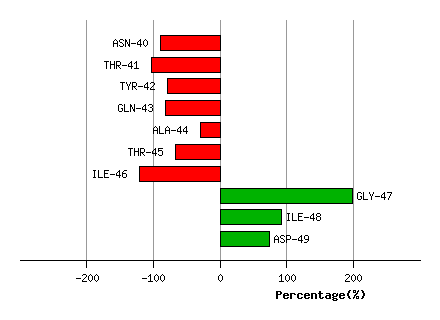
Graph shows rotational transition at bending residues and can be used
to identify hinge bending residues.
Probably only informative for interdomain rotations greater than 20 degrees
Residue
iResidue
i+1Distance of hinge axis to residue i in
(A) Distance of hinge axis to residue i in
(A) Change in
(deg) Change in
(deg) Angle of psi(i) axis to hinge axis
(deg) Angle of psi(i) axis to hinge axis
(deg) Percentage Progress
ASP-68
THR-69
8.9
9.0
13.7
-8.5
80.4
92.0
-8.3
THR-69
ALA-70
7.1
7.3
-0.5
5.1
152.2
151.6
53.8
ALA-70
GLY-71
6.9
7.6
-25.3
14.6
80.5
86.6
75.2
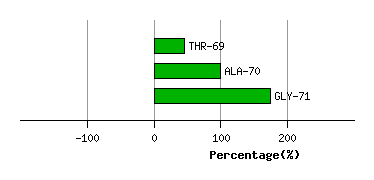
Graph shows rotational transition at bending residues and can be used
to identify hinge bending residues.
Probably only informative for interdomain rotations greater than 20 degrees
Residue
iResidue
i+1Distance of hinge axis to residue i in
(A) Distance of hinge axis to residue i in
(A) Change in
(deg) Change in
(deg) Angle of psi(i) axis to hinge axis
(deg) Angle of psi(i) axis to hinge axis
(deg) Percentage Progress
PRO-80
SER-81
7.4
7.7
-5.6
1.7
124.0
119.3
-9.8
SER-81
TYR-82
9.5
9.9
13.0
-6.2
95.5
96.9
3.7
TYR-82
ILE-83
8.3
8.4
-3.0
-5.1
106.0
113.8
-7.0
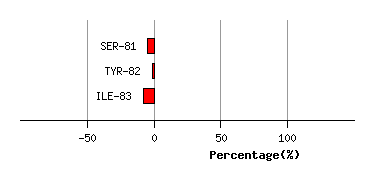
Graph shows rotational transition at bending residues and can be used
to identify hinge bending residues.
Probably only informative for interdomain rotations greater than 20 degrees
Residue
iResidue
i+1Distance of hinge axis to residue i in
(A) Distance of hinge axis to residue i in
(A) Change in
(deg) Change in
(deg) Angle of psi(i) axis to hinge axis
(deg) Angle of psi(i) axis to hinge axis
(deg) Percentage Progress
VAL-90
VAL-91
6.4
6.6
-6.7
13.7
123.1
122.8
-9.2
VAL-91
VAL-92
4.6
4.6
-1.0
8.6
148.3
150.8
-13.3
VAL-92
TYR-93
5.3
5.2
-1.7
2.6
122.7
124.8
26.7
TYR-93
ASP-94
6.1
6.1
-6.9
7.8
32.3
30.7
10.1
TYR-93
ASP-94
6.1
6.1
-6.9
7.8
32.3
30.7
10.1
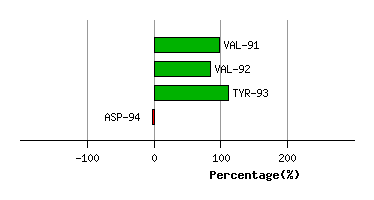
Graph shows rotational transition at bending residues and can be used
to identify hinge bending residues.
Probably only informative for interdomain rotations greater than 20 degrees
Residue
iResidue
i+1Distance of hinge axis to residue i in
(A) Distance of hinge axis to residue i in
(A) Change in
(deg) Change in
(deg) Angle of psi(i) axis to hinge axis
(deg) Angle of psi(i) axis to hinge axis
(deg) Percentage Progress
TYR-93
ASP-94
6.1
6.1
-6.9
7.8
32.3
30.7
10.1
TYR-93
ASP-94
6.1
6.1
-6.9
7.8
32.3
30.7
10.1
ASP-94
ILE-95
7.2
6.9
-0.5
-0.8
80.8
80.3
12.9
ILE-95
THR-96
10.9
10.7
6.2
-7.7
140.2
141.5
-5.7
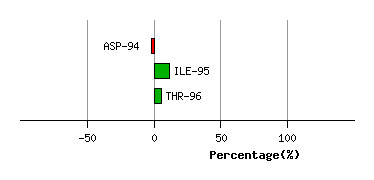
Graph shows rotational transition at bending residues and can be used
to identify hinge bending residues.
Probably only informative for interdomain rotations greater than 20 degrees
Residue
iResidue
i+1Distance of hinge axis to residue i in
(A) Distance of hinge axis to residue i in
(A) Change in
(deg) Change in
(deg) Angle of psi(i) axis to hinge axis
(deg) Angle of psi(i) axis to hinge axis
(deg) Percentage Progress
TRP-107
ILE-108
4.4
4.3
4.6
-1.5
147.8
146.3
-45.5
ILE-108
ASP-109
5.5
5.5
-0.5
4.6
36.2
37.4
-24.2
ASP-109
ASP-110
7.0
7.1
-5.5
-6.4
74.9
70.4
99.4
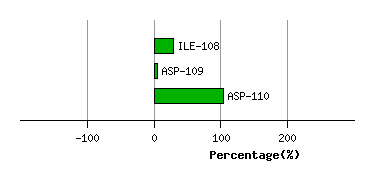
Graph shows rotational transition at bending residues and can be used
to identify hinge bending residues.
Probably only informative for interdomain rotations greater than 20 degrees
Residue
iResidue
i+1Distance of hinge axis to residue i in
(A) Distance of hinge axis to residue i in
(A) Change in
(deg) Change in
(deg) Angle of psi(i) axis to hinge axis
(deg) Angle of psi(i) axis to hinge axis
(deg) Percentage Progress
VAL-119
ILE-120
6.2
6.2
7.1
-8.8
118.9
117.8
16.2
ILE-120
ILE-121
9.0
9.0
-4.9
9.0
27.9
27.9
8.5
ILE-121
MET-122
7.9
7.9
4.5
-9.5
132.4
131.2
-4.7
MET-122
LEU-123
9.7
9.8
-0.9
6.4
43.3
40.6
-48.2
LEU-123
VAL-124
9.4
9.4
3.6
-0.4
147.0
145.0
64.0
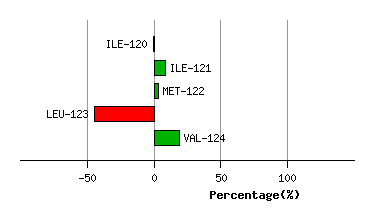
Graph shows rotational transition at bending residues and can be used
to identify hinge bending residues.
Probably only informative for interdomain rotations greater than 20 degrees