Core Protein P3
(All numbering and residues are taken from first PDB file)
![]()
![]()
Bending Residue Dihedral Analysis
Residue
iResidue
i+1Distance of hinge axis to residue i in
(A) Distance of hinge axis to residue i in
(A) Change in
(deg) Change in
(deg) Angle of psi(i) axis to hinge axis
(deg) Angle of psi(i) axis to hinge axis
(deg) Percentage Progress
GLU-109
HIS-110
11.6
15.7
28.8
-31.5
88.4
50.8
-21.1
HIS-110
ASP-111
13.7
16.0
-136.3
-25.0
128.4
142.2
-646.7
ASP-111
SER-112
15.9
18.5
72.5
-44.6
81.1
31.6
188.8
SER-112
ALA-113
16.5
16.9
45.5
30.8
43.3
55.7
422.0
ALA-113
TYR-114
19.2
20.2
-34.4
-23.3
150.4
73.6
-128.7
TYR-114
GLU-115
18.6
20.4
-109.0
-91.3
133.3
86.4
-339.7
GLU-115
PRO-116
17.5
16.8
139.9
-12.6
70.1
34.6
595.8
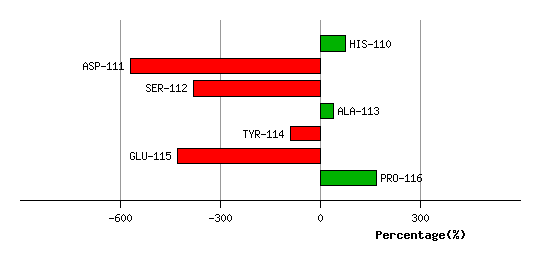
Graph shows rotational transition at bending residues and can be used
to identify hinge bending residues.
Probably only informative for interdomain rotations greater than 20 degrees
Residue
iResidue
i+1Distance of hinge axis to residue i in
(A) Distance of hinge axis to residue i in
(A) Change in
(deg) Change in
(deg) Angle of psi(i) axis to hinge axis
(deg) Angle of psi(i) axis to hinge axis
(deg) Percentage Progress
TYR-127
SER-128
3.2
5.0
-4.7
-2.0
143.5
140.2
-42.8
SER-128
MET-129
3.2
5.7
26.9
21.0
73.0
77.9
78.1
MET-129
LEU-130
6.5
8.8
-58.8
-20.1
34.2
53.2
339.3
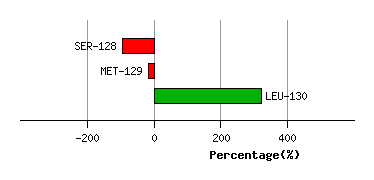
Graph shows rotational transition at bending residues and can be used
to identify hinge bending residues.
Probably only informative for interdomain rotations greater than 20 degrees
Residue
iResidue
i+1Distance of hinge axis to residue i in
(A) Distance of hinge axis to residue i in
(A) Change in
(deg) Change in
(deg) Angle of psi(i) axis to hinge axis
(deg) Angle of psi(i) axis to hinge axis
(deg) Percentage Progress
LEU-229
ALA-230
23.4
22.8
-46.6
47.0
160.3
139.9
-30.1
ALA-230
LEU-231
21.9
20.8
-12.8
-13.1
92.6
96.3
-16.0
LEU-231
HIS-232
18.3
17.4
-13.2
19.6
98.4
96.6
-4.9
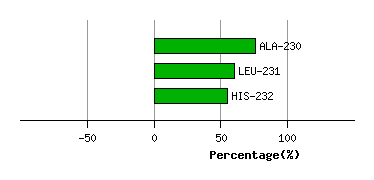
Graph shows rotational transition at bending residues and can be used
to identify hinge bending residues.
Probably only informative for interdomain rotations greater than 20 degrees
Residue
iResidue
i+1Distance of hinge axis to residue i in
(A) Distance of hinge axis to residue i in
(A) Change in
(deg) Change in
(deg) Angle of psi(i) axis to hinge axis
(deg) Angle of psi(i) axis to hinge axis
(deg) Percentage Progress
LEU-234
ALA-235
17.0
17.5
8.5
15.4
83.4
89.0
41.9
ALA-235
ASN-236
17.0
18.4
10.5
-18.0
131.7
146.5
61.9
ASN-236
ASP-237
20.2
20.7
2.3
-9.7
152.9
139.5
21.5
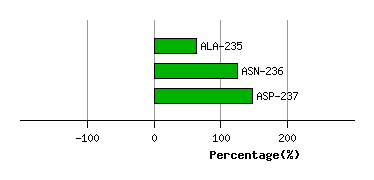
Graph shows rotational transition at bending residues and can be used
to identify hinge bending residues.
Probably only informative for interdomain rotations greater than 20 degrees
Residue
iResidue
i+1Distance of hinge axis to residue i in
(A) Distance of hinge axis to residue i in
(A) Change in
(deg) Change in
(deg) Angle of psi(i) axis to hinge axis
(deg) Angle of psi(i) axis to hinge axis
(deg) Percentage Progress
PRO-283
VAL-284
19.1
19.2
-5.3
40.8
123.3
108.0
83.9
VAL-284
VAL-285
15.9
15.5
-35.8
-29.3
97.7
142.5
-165.6
VAL-285
GLN-286
15.5
14.8
9.9
-76.7
111.1
63.0
35.4
GLN-286
LEU-287
13.9
11.7
28.0
58.2
62.3
69.2
202.9
LEU-287
LEU-288
12.7
11.1
-12.6
7.8
64.1
53.0
16.1
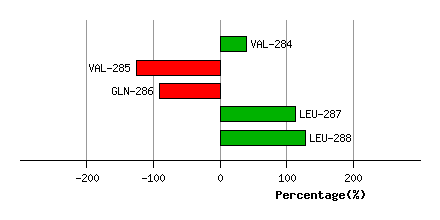
Graph shows rotational transition at bending residues and can be used
to identify hinge bending residues.
Probably only informative for interdomain rotations greater than 20 degrees
Residue
iResidue
i+1Distance of hinge axis to residue i in
(A) Distance of hinge axis to residue i in
(A) Change in
(deg) Change in
(deg) Angle of psi(i) axis to hinge axis
(deg) Angle of psi(i) axis to hinge axis
(deg) Percentage Progress
THR-756
GLN-757
6.9
9.0
1.1
1.6
45.6
38.1
-1.4
GLN-757
ALA-758
9.3
11.1
21.5
-14.6
46.2
42.4
21.4
ALA-758
ASP-759
7.2
8.4
-4.8
2.7
70.0
83.6
15.8
ASP-759
HIS-760
8.0
9.5
-9.7
12.6
89.8
106.3
1.0
HIS-760
VAL-761
11.6
13.0
0.7
0.5
20.7
8.0
11.9
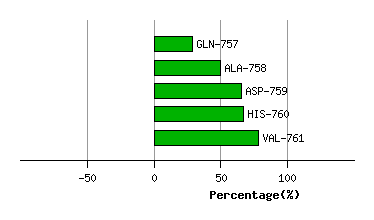
Graph shows rotational transition at bending residues and can be used
to identify hinge bending residues.
Probably only informative for interdomain rotations greater than 20 degrees
Residue
iResidue
i+1Distance of hinge axis to residue i in
(A) Distance of hinge axis to residue i in
(A) Change in
(deg) Change in
(deg) Angle of psi(i) axis to hinge axis
(deg) Angle of psi(i) axis to hinge axis
(deg) Percentage Progress
PRO-1002
ILE-1003
36.3
37.1
-7.8
62.8
113.2
103.1
130.8
ILE-1003
GLY-1004
37.3
39.9
3.6
-125.0
22.0
78.4
-445.0
GLY-1004
VAL-1005
38.6
43.0
42.4
36.1
81.8
42.8
86.5
VAL-1005
HIS-1006
41.0
43.7
13.2
-56.6
52.2
40.9
-241.5
HIS-1006
GLY-1007
40.2
42.3
25.4
32.1
50.7
36.6
248.1
GLY-1007
VAL-1008
41.9
41.4
-65.2
-11.9
98.9
87.4
9.5
VAL-1008
ARG-1009
42.5
38.2
6.6
2.0
46.5
24.3
47.0
ARG-1009
LEU-1010
39.7
36.0
6.4
-0.4
75.3
100.3
-29.0
LEU-1010
ASP-1011
40.9
33.8
-34.7
-1.1
98.1
134.2
-76.3
ASP-1011
PRO-1012
39.4
30.5
0.8
-8.3
24.1
54.2
-30.0
PRO-1012
ASN-1013
36.7
30.1
-173.7
11.9
132.0
89.7
492.6
ASN-1013
GLY-1014
37.9
27.4
171.1
-137.5
69.1
37.5
218.4
GLY-1014
ASP-1015
41.5
24.3
-78.2
-51.8
73.7
143.8
-290.0
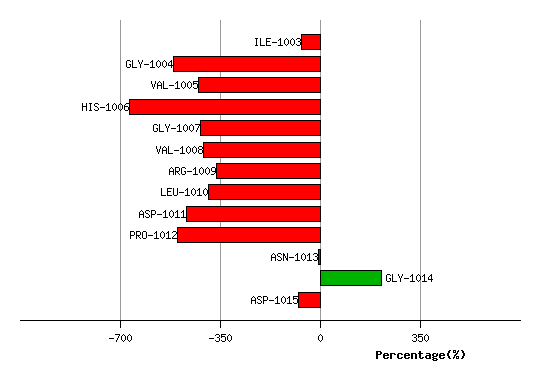
Graph shows rotational transition at bending residues and can be used
to identify hinge bending residues.
Probably only informative for interdomain rotations greater than 20 degrees