Interleukin-6 Receptor Beta Chain
(All numbering and residues are taken from first PDB file)
![]()
![]()
Bending Residue Dihedral Analysis
Residue
iResidue
i+1Distance of hinge axis to residue i in
(A) Distance of hinge axis to residue i in
(A) Change in
(deg) Change in
(deg) Angle of psi(i) axis to hinge axis
(deg) Angle of psi(i) axis to hinge axis
(deg) Percentage Progress
ILE-113
VAL-114
3.4
3.6
-12.8
15.9
94.7
91.0
9.3
VAL-114
ASN-115
4.4
4.3
-2.0
7.5
160.3
159.3
38.6
ASN-115
GLU-116
6.7
6.6
-16.2
6.7
101.5
98.7
25.6
GLU-116
GLY-117
8.4
7.8
3.8
-18.7
69.3
77.1
-59.3
GLU-116
GLY-117
8.4
7.8
3.8
-18.7
69.3
77.1
-59.3
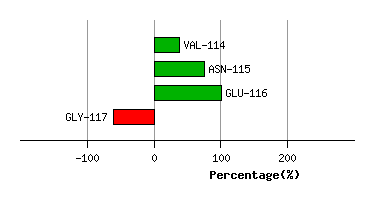
Graph shows rotational transition at bending residues and can be used
to identify hinge bending residues.
Probably only informative for interdomain rotations greater than 20 degrees
Residue
iResidue
i+1Distance of hinge axis to residue i in
(A) Distance of hinge axis to residue i in
(A) Change in
(deg) Change in
(deg) Angle of psi(i) axis to hinge axis
(deg) Angle of psi(i) axis to hinge axis
(deg) Percentage Progress
GLU-116
GLY-117
8.4
7.8
3.8
-18.7
69.3
77.1
-59.3
GLU-116
GLY-117
8.4
7.8
3.8
-18.7
69.3
77.1
-59.3
GLY-117
LYS-118
11.7
11.2
66.1
-53.3
20.5
41.4
96.0
LYS-118
LYS-119
11.4
10.8
8.7
-5.4
51.4
33.1
12.7
LYS-119
MET-120
9.8
9.8
-31.8
9.4
91.8
92.3
36.4
MET-120
ARG-121
6.3
6.4
-20.3
28.9
112.9
114.1
56.0
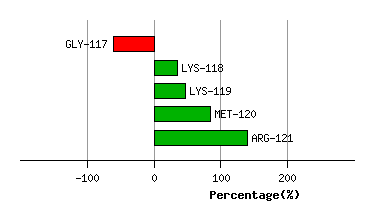
Graph shows rotational transition at bending residues and can be used
to identify hinge bending residues.
Probably only informative for interdomain rotations greater than 20 degrees
Residue
iResidue
i+1Distance of hinge axis to residue i in
(A) Distance of hinge axis to residue i in
(A) Change in
(deg) Change in
(deg) Angle of psi(i) axis to hinge axis
(deg) Angle of psi(i) axis to hinge axis
(deg) Percentage Progress
VAL-167
TYR-168
9.5
10.5
2.0
13.1
62.5
71.8
74.2
TYR-168
PHE-169
9.2
9.7
7.0
2.1
107.4
109.9
8.5
PHE-169
VAL-170
11.1
11.5
-25.2
14.3
11.7
9.9
71.6
VAL-170
ASN-171
10.4
10.7
-4.2
-2.9
72.4
74.1
22.2
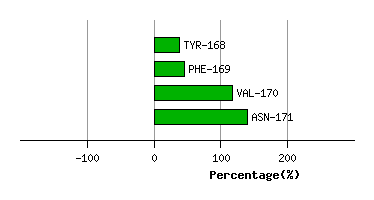
Graph shows rotational transition at bending residues and can be used
to identify hinge bending residues.
Probably only informative for interdomain rotations greater than 20 degrees
Residue
iResidue
i+1Distance of hinge axis to residue i in
(A) Distance of hinge axis to residue i in
(A) Change in
(deg) Change in
(deg) Angle of psi(i) axis to hinge axis
(deg) Angle of psi(i) axis to hinge axis
(deg) Percentage Progress
ASP-193
PRO-194
6.3
6.8
16.0
-18.9
50.1
51.4
-25.2
PRO-194
VAL-195
4.0
4.3
16.6
-8.3
10.5
11.6
48.8
VAL-195
TYR-196
5.9
6.1
14.0
-22.7
56.5
64.3
-12.9
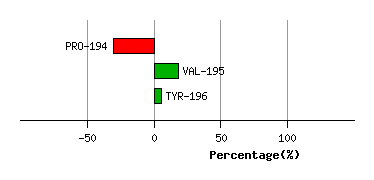
Graph shows rotational transition at bending residues and can be used
to identify hinge bending residues.
Probably only informative for interdomain rotations greater than 20 degrees