DNA Topoisomerase I
(All numbering and residues are taken from first PDB file)
![]()
![]()
Bending Residue Dihedral Analysis
Residue
iResidue
i+1Distance of hinge axis to residue i in
(A) Distance of hinge axis to residue i in
(A) Change in
(deg) Change in
(deg) Angle of psi(i) axis to hinge axis
(deg) Angle of psi(i) axis to hinge axis
(deg) Percentage Progress
ARG-271
GLU-272
8.4
8.9
-12.6
24.8
131.8
137.7
10.8
GLU-272
ASP-273
5.1
6.0
-14.0
13.2
73.4
85.9
7.4
ASP-273
LYS-274
2.0
3.4
25.8
17.7
55.0
55.4
54.5
LYS-274
PRO-275
1.6
1.0
-38.9
9.7
63.8
81.9
21.1
PRO-275
THR-276
5.3
4.8
-0.7
-8.1
69.8
72.2
6.2
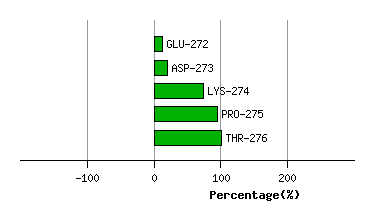
Graph shows rotational transition at bending residues and can be used
to identify hinge bending residues.
Probably only informative for interdomain rotations greater than 20 degrees
Residue
iResidue
i+1Distance of hinge axis to residue i in
(A) Distance of hinge axis to residue i in
(A) Change in
(deg) Change in
(deg) Angle of psi(i) axis to hinge axis
(deg) Angle of psi(i) axis to hinge axis
(deg) Percentage Progress
ASP-409
SER-410
5.1
5.3
-2.9
25.0
130.0
134.4
29.0
SER-410
THR-411
1.9
2.3
-37.9
7.6
72.4
84.2
31.5
THR-411
THR-412
1.9
2.6
32.9
-12.2
59.5
48.9
38.2
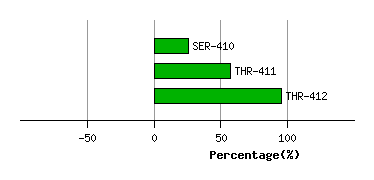
Graph shows rotational transition at bending residues and can be used
to identify hinge bending residues.
Probably only informative for interdomain rotations greater than 20 degrees
Residue
iResidue
i+1Distance of hinge axis to residue i in
(A) Distance of hinge axis to residue i in
(A) Change in
(deg) Change in
(deg) Angle of psi(i) axis to hinge axis
(deg) Angle of psi(i) axis to hinge axis
(deg) Percentage Progress
ALA-424
ARG-425
6.4
5.9
1.9
-2.6
52.3
40.6
-0.7
ARG-425
GLY-426
3.3
2.8
6.4
-51.6
108.0
103.5
21.1
GLY-426
ARG-427
0.9
1.5
62.7
10.4
48.3
34.8
80.7
ARG-427
ILE-428
3.5
4.5
1.0
4.1
102.5
96.0
-3.9
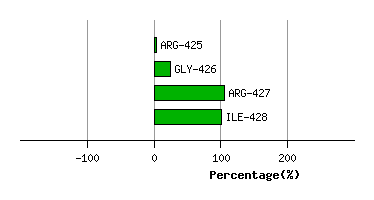
Graph shows rotational transition at bending residues and can be used
to identify hinge bending residues.
Probably only informative for interdomain rotations greater than 20 degrees
Residue
iResidue
i+1Distance of hinge axis to residue i in
(A) Distance of hinge axis to residue i in
(A) Change in
(deg) Change in
(deg) Angle of psi(i) axis to hinge axis
(deg) Angle of psi(i) axis to hinge axis
(deg) Percentage Progress
ASP-447
ARG-448
3.5
4.7
-109.0
64.7
103.5
111.5
-8.3
ARG-448
ILE-449
4.6
4.5
-28.3
15.0
30.8
49.3
15.3
ILE-449
LEU-450
6.4
7.0
5.6
-28.8
88.1
78.0
2.5
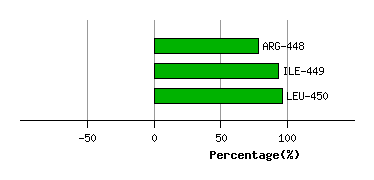
Graph shows rotational transition at bending residues and can be used
to identify hinge bending residues.
Probably only informative for interdomain rotations greater than 20 degrees