Tryptophan Synthase Beta Chain 1
(All numbering and residues are taken from first PDB file)
![]()
![]()
Bending Residue Dihedral Analysis
Residue
iResidue
i+1Distance of hinge axis to residue i in
(A) Distance of hinge axis to residue i in
(A) Change in
(deg) Change in
(deg) Angle of psi(i) axis to hinge axis
(deg) Angle of psi(i) axis to hinge axis
(deg) Percentage Progress
LEU-19
LYS-20
9.2
9.1
14.7
-17.2
75.6
80.4
-49.2
LEU-19
LYS-20
9.2
9.1
14.7
-17.2
75.6
80.4
-49.2
LYS-20
GLU-21
8.8
8.7
4.5
5.3
103.6
104.6
-87.6
GLU-21
LEU-22
5.1
5.0
-10.5
5.8
11.0
9.0
95.2
LEU-22
GLU-23
5.4
5.3
-10.0
-1.6
75.1
71.8
88.9
GLU-23
LYS-24
8.5
8.5
6.7
-3.9
81.7
79.3
-41.0
LYS-24
ALA-25
7.7
8.0
3.5
-4.4
134.3
130.3
1.0
ALA-25
TYR-26
5.3
5.5
10.5
-14.5
149.9
155.4
42.9
TYR-26
LYS-27
6.9
7.0
3.8
3.0
88.9
91.6
7.1
LYS-27
ARG-28
10.2
10.5
0.1
0.3
96.6
99.8
-68.9
ARG-28
PHE-29
10.1
10.4
-30.9
34.9
30.5
28.3
-64.4
PHE-29
LYS-30
8.5
8.4
-3.8
0.1
36.1
34.9
35.9
LYS-30
ASP-31
9.6
9.5
-3.3
5.3
54.7
54.5
16.9
ASP-31
ASP-32
12.5
12.4
-1.3
-2.8
98.4
99.2
-23.4
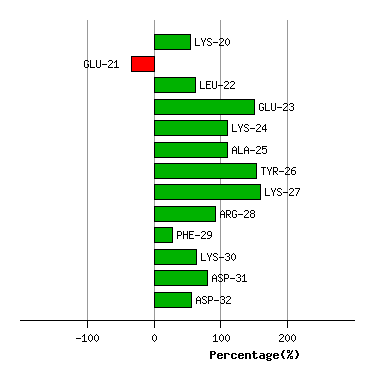
Graph shows rotational transition at bending residues and can be used
to identify hinge bending residues.
Probably only informative for interdomain rotations greater than 20 degrees
Residue
iResidue
i+1Distance of hinge axis to residue i in
(A) Distance of hinge axis to residue i in
(A) Change in
(deg) Change in
(deg) Angle of psi(i) axis to hinge axis
(deg) Angle of psi(i) axis to hinge axis
(deg) Percentage Progress
GLN-38
LEU-39
8.8
8.6
-6.6
2.8
64.4
62.1
26.0
LEU-39
ASN-40
5.7
5.3
-2.5
-0.6
8.7
8.5
48.0
ASN-40
TYR-41
7.3
7.0
7.8
-9.7
117.6
117.7
-40.9
TYR-41
TYR-42
8.5
8.4
-2.3
1.9
105.9
105.4
20.3
TYR-41
TYR-42
8.5
8.4
-2.3
1.9
105.9
105.4
20.3
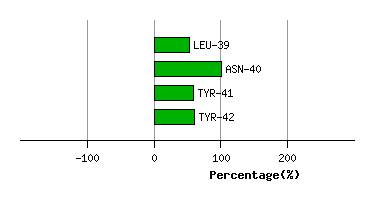
Graph shows rotational transition at bending residues and can be used
to identify hinge bending residues.
Probably only informative for interdomain rotations greater than 20 degrees
Residue
iResidue
i+1Distance of hinge axis to residue i in
(A) Distance of hinge axis to residue i in
(A) Change in
(deg) Change in
(deg) Angle of psi(i) axis to hinge axis
(deg) Angle of psi(i) axis to hinge axis
(deg) Percentage Progress
TYR-41
TYR-42
8.5
8.4
-2.3
1.9
105.9
105.4
20.3
TYR-41
TYR-42
8.5
8.4
-2.3
1.9
105.9
105.4
20.3
TYR-42
LEU-43
5.9
5.9
3.5
-5.7
47.8
49.1
-47.0
LEU-43
LYS-44
3.2
3.1
-1.2
0.6
158.7
158.8
-16.1
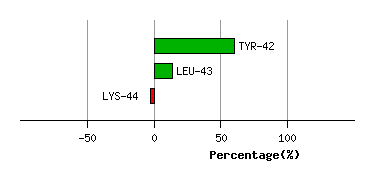
Graph shows rotational transition at bending residues and can be used
to identify hinge bending residues.
Probably only informative for interdomain rotations greater than 20 degrees
Residue
iResidue
i+1Distance of hinge axis to residue i in
(A) Distance of hinge axis to residue i in
(A) Change in
(deg) Change in
(deg) Angle of psi(i) axis to hinge axis
(deg) Angle of psi(i) axis to hinge axis
(deg) Percentage Progress
THR-45
TRP-46
7.8
7.7
-5.2
5.4
97.4
95.4
-18.4
TRP-46
ALA-47
6.6
6.6
4.7
-9.6
108.7
110.3
68.8
ALA-47
GLY-48
3.2
3.2
9.4
-15.7
162.9
159.2
107.1
GLY-48
ARG-49
2.8
2.7
19.2
-13.2
98.3
94.5
-67.9
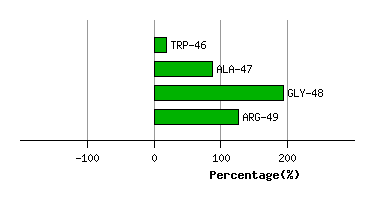
Graph shows rotational transition at bending residues and can be used
to identify hinge bending residues.
Probably only informative for interdomain rotations greater than 20 degrees
Residue
iResidue
i+1Distance of hinge axis to residue i in
(A) Distance of hinge axis to residue i in
(A) Change in
(deg) Change in
(deg) Angle of psi(i) axis to hinge axis
(deg) Angle of psi(i) axis to hinge axis
(deg) Percentage Progress
THR-83
ASN-84
5.7
5.8
-3.5
1.2
67.8
67.0
44.0
ASN-84
ASN-85
3.9
3.9
9.9
-11.8
175.1
172.4
27.6
ASN-85
ALA-86
5.5
5.6
5.8
-7.6
119.0
120.8
7.1
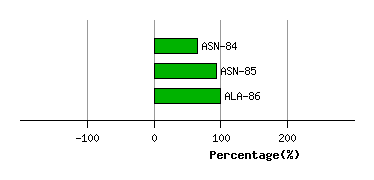
Graph shows rotational transition at bending residues and can be used
to identify hinge bending residues.
Probably only informative for interdomain rotations greater than 20 degrees
Residue
iResidue
i+1Distance of hinge axis to residue i in
(A) Distance of hinge axis to residue i in
(A) Change in
(deg) Change in
(deg) Angle of psi(i) axis to hinge axis
(deg) Angle of psi(i) axis to hinge axis
(deg) Percentage Progress
ALA-90
LEU-91
3.6
3.8
2.5
-0.8
75.7
75.7
9.1
LEU-91
LEU-92
3.0
2.9
-1.5
2.0
150.5
151.9
15.6
LEU-92
ALA-93
1.5
1.4
-1.7
1.9
140.2
141.1
-17.0
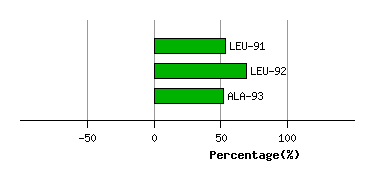
Graph shows rotational transition at bending residues and can be used
to identify hinge bending residues.
Probably only informative for interdomain rotations greater than 20 degrees
Residue
iResidue
i+1Distance of hinge axis to residue i in
(A) Distance of hinge axis to residue i in
(A) Change in
(deg) Change in
(deg) Angle of psi(i) axis to hinge axis
(deg) Angle of psi(i) axis to hinge axis
(deg) Percentage Progress
LYS-94
PHE-95
5.4
5.4
-8.7
4.0
60.0
56.7
8.3
PHE-95
MET-96
5.5
5.3
16.8
-27.2
162.9
160.2
193.7
MET-96
GLY-97
3.3
3.2
13.3
-10.0
121.0
119.7
-53.6
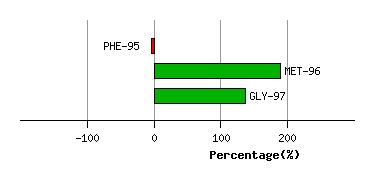
Graph shows rotational transition at bending residues and can be used
to identify hinge bending residues.
Probably only informative for interdomain rotations greater than 20 degrees
Residue
iResidue
i+1Distance of hinge axis to residue i in
(A) Distance of hinge axis to residue i in
(A) Change in
(deg) Change in
(deg) Angle of psi(i) axis to hinge axis
(deg) Angle of psi(i) axis to hinge axis
(deg) Percentage Progress
HIS-180
TYR-181
6.7
6.8
-6.6
6.4
59.6
60.8
-1.9
TYR-181
LEU-182
9.3
9.4
-6.3
-4.6
35.1
35.1
171.2
LEU-182
ILE-183
8.9
8.8
-4.6
5.8
67.1
62.7
-10.5
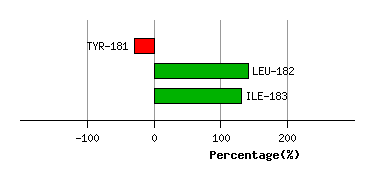
Graph shows rotational transition at bending residues and can be used
to identify hinge bending residues.
Probably only informative for interdomain rotations greater than 20 degrees
Residue
iResidue
i+1Distance of hinge axis to residue i in
(A) Distance of hinge axis to residue i in
(A) Change in
(deg) Change in
(deg) Angle of psi(i) axis to hinge axis
(deg) Angle of psi(i) axis to hinge axis
(deg) Percentage Progress
PRO-191
TYR-192
11.8
12.1
0.4
0.0
24.7
28.3
-0.2
PRO-191
TYR-192
11.8
12.1
0.4
0.0
24.7
28.3
-0.2
TYR-192
PRO-193
11.4
11.6
6.2
-10.9
38.1
36.0
-29.1
PRO-193
THR-194
14.4
14.4
2.8
16.4
65.8
70.3
205.2
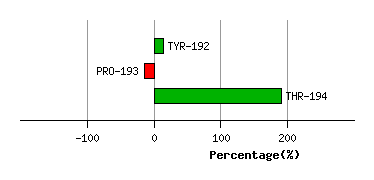
Graph shows rotational transition at bending residues and can be used
to identify hinge bending residues.
Probably only informative for interdomain rotations greater than 20 degrees
Residue
iResidue
i+1Distance of hinge axis to residue i in
(A) Distance of hinge axis to residue i in
(A) Change in
(deg) Change in
(deg) Angle of psi(i) axis to hinge axis
(deg) Angle of psi(i) axis to hinge axis
(deg) Percentage Progress
ILE-195
VAL-196
9.6
9.6
0.1
-3.2
155.2
156.0
72.7
VAL-196
ARG-197
9.6
9.8
2.5
-5.8
137.5
137.6
50.7
ARG-197
ASP-198
12.0
12.2
6.7
-6.0
103.8
102.1
-58.4
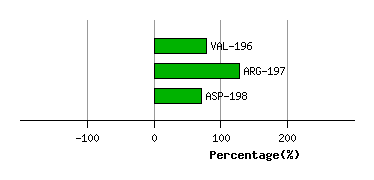
Graph shows rotational transition at bending residues and can be used
to identify hinge bending residues.
Probably only informative for interdomain rotations greater than 20 degrees