Delta Prime
(All numbering and residues are taken from first PDB file)
![]()
![]()
Bending Residue Dihedral Analysis
Residue
iResidue
i+1Distance of hinge axis to residue i in
(A) Distance of hinge axis to residue i in
(A) Change in
(deg) Change in
(deg) Angle of psi(i) axis to hinge axis
(deg) Angle of psi(i) axis to hinge axis
(deg) Percentage Progress
LEU-204
PHE-205
5.4
4.3
4.8
-8.1
50.7
51.8
15.9
PHE-205
GLN-206
3.1
2.9
-25.6
44.2
152.7
149.5
57.5
GLN-206
GLY-207
5.3
4.4
-107.5
171.9
89.7
102.8
46.9
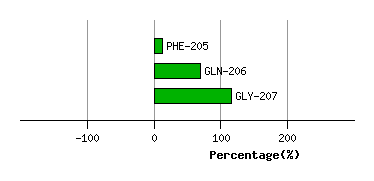
Graph shows rotational transition at bending residues and can be used
to identify hinge bending residues.
Probably only informative for interdomain rotations greater than 20 degrees
Residue
iResidue
i+1Distance of hinge axis to residue i in
(A) Distance of hinge axis to residue i in
(A) Change in
(deg) Change in
(deg) Angle of psi(i) axis to hinge axis
(deg) Angle of psi(i) axis to hinge axis
(deg) Percentage Progress
LEU-256
LYS-257
6.2
6.3
-40.1
36.6
104.5
105.0
-13.1
LYS-257
ARG-258
3.7
3.5
-77.2
-111.6
103.3
104.8
259.3
VAL-265
THR-266
2.7
4.2
12.5
16.8
22.1
22.4
158.5
VAL-265
THR-266
2.7
4.2
12.5
16.8
22.1
22.4
158.5
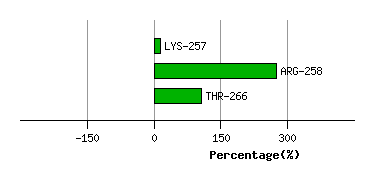
Graph shows rotational transition at bending residues and can be used
to identify hinge bending residues.
Probably only informative for interdomain rotations greater than 20 degrees
Residue
iResidue
i+1Distance of hinge axis to residue i in
(A) Distance of hinge axis to residue i in
(A) Change in
(deg) Change in
(deg) Angle of psi(i) axis to hinge axis
(deg) Angle of psi(i) axis to hinge axis
(deg) Percentage Progress
VAL-265
THR-266
2.7
4.2
12.5
16.8
22.1
22.4
158.5
VAL-265
THR-266
2.7
4.2
12.5
16.8
22.1
22.4
158.5
THR-266
ASN-267
0.6
1.7
2.6
-8.2
47.4
45.4
-63.3
ASN-267
VAL-268
3.9
4.8
4.3
-4.9
90.5
88.9
20.1
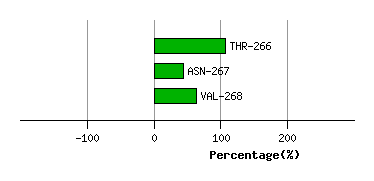
Graph shows rotational transition at bending residues and can be used
to identify hinge bending residues.
Probably only informative for interdomain rotations greater than 20 degrees