Polyprotein
(All numbering and residues are taken from first PDB file)
![]()
![]()
Bending Residue Dihedral Analysis
Residue
iResidue
i+1Distance of hinge axis to residue i in
(A) Distance of hinge axis to residue i in
(A) Change in
(deg) Change in
(deg) Angle of psi(i) axis to hinge axis
(deg) Angle of psi(i) axis to hinge axis
(deg) Percentage Progress
VAL-43
LYS-44
10.0
10.0
2.5
-9.3
159.9
156.4
33.8
LYS-44
MET-45
9.2
9.3
-9.5
2.7
48.4
52.2
90.0
MET-45
MET-46
7.9
7.6
26.6
-11.2
118.6
120.0
-68.5
MET-46
ASN-47
5.6
5.5
-29.7
42.7
16.5
18.2
-31.2
ASN-47
MET-48
3.8
3.5
11.6
17.2
101.4
105.2
-32.6
MET-48
GLU-49
4.6
4.4
-4.1
-8.7
30.6
45.6
87.2
GLU-49
ALA-50
3.5
3.4
14.0
1.0
107.1
101.1
-76.1
ALA-50
ALA-51
6.1
6.2
-14.3
16.9
72.9
93.0
31.3
ALA-51
ASN-52
7.3
7.8
-2.4
2.0
74.3
75.5
-2.5
ASN-52
LEU-53
10.7
11.3
6.7
-16.2
126.9
147.8
58.6
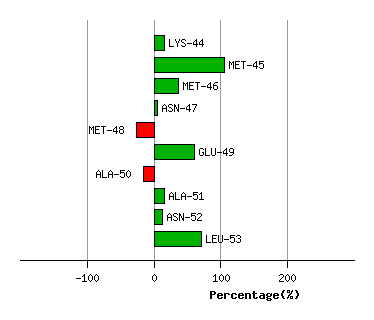
Graph shows rotational transition at bending residues and can be used
to identify hinge bending residues.
Probably only informative for interdomain rotations greater than 20 degrees
Residue
iResidue
i+1Distance of hinge axis to residue i in
(A) Distance of hinge axis to residue i in
(A) Change in
(deg) Change in
(deg) Angle of psi(i) axis to hinge axis
(deg) Angle of psi(i) axis to hinge axis
(deg) Percentage Progress
LEU-131
LYS-132
14.1
14.1
-9.3
9.7
28.5
46.3
14.7
LYS-132
GLU-133
13.9
14.2
9.8
-28.8
134.5
147.1
95.1
GLU-133
ASN-134
14.2
14.3
11.0
-9.5
89.2
92.3
-40.3
ASN-134
ILE-135
10.8
11.0
4.5
5.9
121.8
108.7
-19.9
ILE-135
LYS-136
9.0
9.3
-14.3
2.8
19.9
13.6
70.3
LYS-136
TYR-137
6.7
7.2
8.7
2.2
101.2
100.3
-15.8
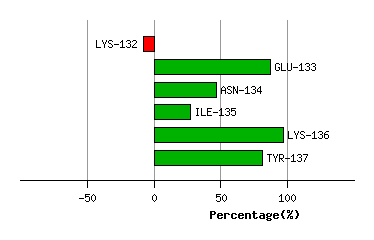
Graph shows rotational transition at bending residues and can be used
to identify hinge bending residues.
Probably only informative for interdomain rotations greater than 20 degrees
Residue
iResidue
i+1Distance of hinge axis to residue i in
(A) Distance of hinge axis to residue i in
(A) Change in
(deg) Change in
(deg) Angle of psi(i) axis to hinge axis
(deg) Angle of psi(i) axis to hinge axis
(deg) Percentage Progress
ARG-193
SER-194
16.5
16.6
77.5
-21.2
106.7
104.7
42.0
SER-194
GLY-195
16.1
15.9
53.0
153.4
139.8
151.5
783.1
GLY-195
ILE-196
15.8
17.4
152.3
-52.8
151.7
131.9
-516.7
ILE-196
ASP-197
14.5
14.8
44.8
0.8
95.9
143.2
-170.0
ASP-197
THR-198
16.9
14.2
-50.1
24.6
81.3
98.5
-43.5
THR-198
ASN-199
17.0
15.4
154.7
106.8
161.0
116.0
450.9
ASN-199
ALA-200
16.5
13.6
-43.4
31.8
48.9
12.7
84.0
ALA-200
TYR-201
15.2
15.3
93.1
3.4
128.8
130.5
-359.6
TYR-201
TYR-202
11.9
11.9
2.0
8.0
75.3
85.4
60.2
TYR-202
VAL-203
9.4
10.0
2.2
3.7
86.4
76.2
61.0
VAL-203
MET-204
5.9
6.8
-29.7
47.7
47.3
40.0
-73.5
MET-204
THR-205
4.9
4.9
-0.8
-14.8
86.2
102.0
-8.3
THR-205
VAL-206
4.2
4.3
7.8
-22.7
160.0
152.5
63.0
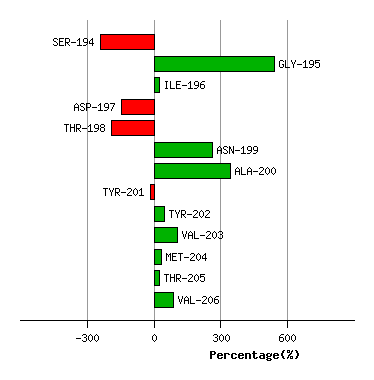
Graph shows rotational transition at bending residues and can be used
to identify hinge bending residues.
Probably only informative for interdomain rotations greater than 20 degrees
Residue
iResidue
i+1Distance of hinge axis to residue i in
(A) Distance of hinge axis to residue i in
(A) Change in
(deg) Change in
(deg) Angle of psi(i) axis to hinge axis
(deg) Angle of psi(i) axis to hinge axis
(deg) Percentage Progress
SER-275
SER-276
6.6
6.5
9.0
-61.2
133.1
82.3
105.7
SER-276
ASN-277
8.6
9.2
-109.3
-166.6
81.1
66.5
-86.7
ASN-277
THR-278
7.8
8.7
-26.3
13.4
53.6
67.5
13.9
THR-278
VAL-279
4.7
5.0
-12.3
-0.7
111.7
126.8
-48.4
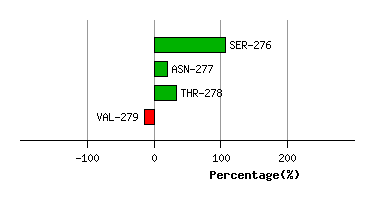
Graph shows rotational transition at bending residues and can be used
to identify hinge bending residues.
Probably only informative for interdomain rotations greater than 20 degrees