Elastase (E.C.3.4.24.26)
(All numbering and residues are taken from first PDB file)
![]()
![]()
Bending Residue Dihedral Analysis
Residue
iResidue
i+1Distance of hinge axis to residue i in
(A) Distance of hinge axis to residue i in
(A) Change in
(deg) Change in
(deg) Angle of psi(i) axis to hinge axis
(deg) Angle of psi(i) axis to hinge axis
(deg) Percentage Progress
GLY-81
VAL-82
2.3
2.4
5.0
-4.1
116.9
117.4
6.3
VAL-82
VAL-83
4.5
4.4
-1.7
-3.7
83.6
82.1
63.3
VAL-83
PHE-84
6.7
6.5
-0.2
5.7
145.7
147.9
42.9
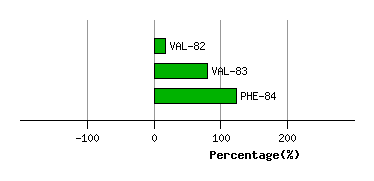
Graph shows rotational transition at bending residues and can be used
to identify hinge bending residues.
Probably only informative for interdomain rotations greater than 20 degrees
Residue
iResidue
i+1Distance of hinge axis to residue i in
(A) Distance of hinge axis to residue i in
(A) Change in
(deg) Change in
(deg) Angle of psi(i) axis to hinge axis
(deg) Angle of psi(i) axis to hinge axis
(deg) Percentage Progress
HIS-98
LYS-99
13.8
14.5
4.2
3.6
68.7
71.8
-2.7
LYS-99
LEU-100
10.7
11.2
-0.2
14.1
158.1
162.7
112.8
LEU-100
TYR-101
9.9
9.8
-16.1
3.2
92.3
90.2
6.2
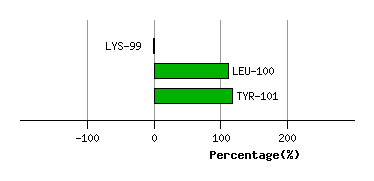
Graph shows rotational transition at bending residues and can be used
to identify hinge bending residues.
Probably only informative for interdomain rotations greater than 20 degrees
Residue
iResidue
i+1Distance of hinge axis to residue i in
(A) Distance of hinge axis to residue i in
(A) Change in
(deg) Change in
(deg) Angle of psi(i) axis to hinge axis
(deg) Angle of psi(i) axis to hinge axis
(deg) Percentage Progress
ASN-112
ALA-113
14.0
13.6
6.1
-1.1
20.1
17.3
43.5
ALA-113
TYR-114
12.7
12.4
20.9
-31.6
75.9
78.2
-0.6
TYR-114
TRP-115
15.1
14.6
17.3
9.3
36.6
27.1
234.7
TRP-115
ASP-116
15.0
15.6
-16.2
21.9
111.7
95.3
68.1
ASP-116
GLY-117
18.0
18.8
8.5
-12.8
48.3
49.3
-22.8
GLY-117
THR-118
17.1
19.8
6.3
-3.6
35.0
20.1
31.6
THR-118
ALA-119
15.1
17.9
5.2
-19.2
105.0
91.8
30.2
ALA-119
MET-120
13.8
14.7
28.7
-1.3
174.1
162.1
-207.1
MET-120
LEU-121
12.0
12.4
3.5
-5.9
97.0
102.2
-52.5
LEU-121
PHE-122
13.9
13.5
19.0
-18.4
146.5
144.9
-17.3
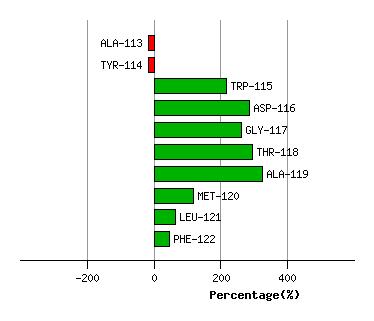
Graph shows rotational transition at bending residues and can be used
to identify hinge bending residues.
Probably only informative for interdomain rotations greater than 20 degrees
Residue
iResidue
i+1Distance of hinge axis to residue i in
(A) Distance of hinge axis to residue i in
(A) Change in
(deg) Change in
(deg) Angle of psi(i) axis to hinge axis
(deg) Angle of psi(i) axis to hinge axis
(deg) Percentage Progress
VAL-133
SER-134
6.2
6.1
-47.3
34.7
66.0
82.2
-5.2
SER-134
LEU-135
2.9
2.6
27.1
1.3
52.1
54.6
145.7
LEU-135
ASP-136
1.9
1.7
3.5
-2.3
110.9
111.6
0.3
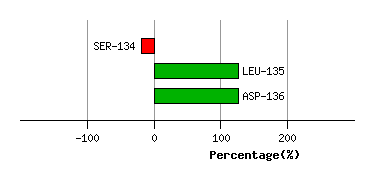
Graph shows rotational transition at bending residues and can be used
to identify hinge bending residues.
Probably only informative for interdomain rotations greater than 20 degrees
Residue
iResidue
i+1Distance of hinge axis to residue i in
(A) Distance of hinge axis to residue i in
(A) Change in
(deg) Change in
(deg) Angle of psi(i) axis to hinge axis
(deg) Angle of psi(i) axis to hinge axis
(deg) Percentage Progress
LEU-185
ILE-186
5.9
5.7
-25.8
22.8
41.6
47.2
54.8
ILE-186
GLY-187
5.9
6.0
-12.1
4.1
99.4
93.7
-10.1
GLY-187
TYR-188
3.8
4.0
0.6
8.8
54.5
59.3
31.7
TYR-188
ASP-189
0.6
0.8
-10.6
2.8
64.9
64.9
31.0
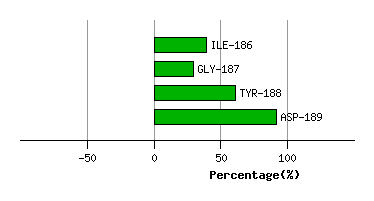
Graph shows rotational transition at bending residues and can be used
to identify hinge bending residues.
Probably only informative for interdomain rotations greater than 20 degrees
Residue
iResidue
i+1Distance of hinge axis to residue i in
(A) Distance of hinge axis to residue i in
(A) Change in
(deg) Change in
(deg) Angle of psi(i) axis to hinge axis
(deg) Angle of psi(i) axis to hinge axis
(deg) Percentage Progress
SER-194
GLY-195
3.6
3.6
-174.1
163.7
113.8
105.8
-89.5
GLY-195
ALA-196
1.4
0.7
2.8
6.9
12.7
25.5
79.8
ALA-196
LEU-197
3.1
3.1
12.7
-5.4
92.9
100.3
15.1
LEU-197
ARG-198
6.8
6.9
5.2
3.4
111.3
108.8
-37.5
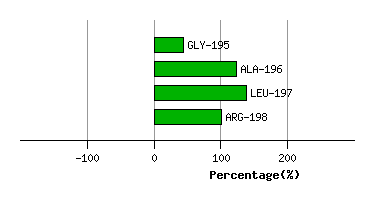
Graph shows rotational transition at bending residues and can be used
to identify hinge bending residues.
Probably only informative for interdomain rotations greater than 20 degrees