Bisphosphoglycerate Mutase
(All numbering and residues are taken from first PDB file)
![]()
![]()
Bending Residue Dihedral Analysis
Residue
iResidue
i+1Distance of hinge axis to residue i in
(A) Distance of hinge axis to residue i in
(A) Change in
(deg) Change in
(deg) Angle of psi(i) axis to hinge axis
(deg) Angle of psi(i) axis to hinge axis
(deg) Percentage Progress
LEU-9
ARG-10
19.7
19.4
-5.1
40.8
119.1
117.8
58.6
ARG-10
HIS-11
16.8
16.3
-12.3
19.4
168.2
156.6
13.6
HIS-11
GLY-12
16.4
16.8
3.0
-1.3
68.9
51.8
3.8
GLY-12
GLU-13
15.6
17.4
23.6
22.8
76.0
62.1
43.3
GLU-13
GLY-14
11.9
14.7
-23.1
-21.8
169.5
128.6
-100.3
GLY-14
ALA-15
10.1
12.3
-32.1
19.3
111.0
124.3
4.1
ALA-15
TRP-16
7.9
9.7
4.3
-25.6
125.3
118.2
35.2
TRP-16
ASN-17
4.8
6.9
21.6
-4.4
140.0
126.5
-41.3
ASN-17
LYS-18
7.0
9.2
-16.1
12.3
103.0
127.0
12.0
LYS-18
GLU-19
9.1
10.3
-9.9
3.3
100.8
106.0
5.5
GLU-19
ASN-20
6.6
6.8
-17.0
4.5
28.4
40.1
27.3
ASN-20
ARG-21
6.2
6.7
8.5
-8.7
98.4
103.7
8.3
ARG-21
PHE-22
2.4
3.1
-14.3
42.5
58.0
39.6
-37.8
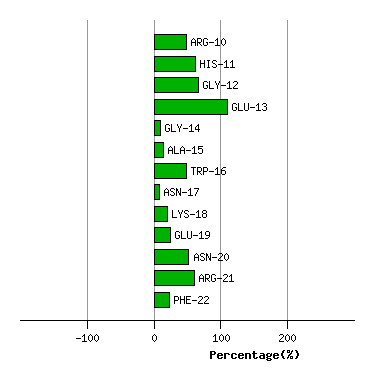
Graph shows rotational transition at bending residues and can be used
to identify hinge bending residues.
Probably only informative for interdomain rotations greater than 20 degrees
Residue
iResidue
i+1Distance of hinge axis to residue i in
(A) Distance of hinge axis to residue i in
(A) Change in
(deg) Change in
(deg) Angle of psi(i) axis to hinge axis
(deg) Angle of psi(i) axis to hinge axis
(deg) Percentage Progress
GLY-97
LEU-98
3.3
2.5
42.0
-29.4
85.5
82.7
10.7
LEU-98
ASN-99
4.3
2.9
-7.6
23.5
78.4
91.0
8.3
ASN-99
ARG-100
4.9
4.5
-50.2
-9.3
47.3
35.1
118.6
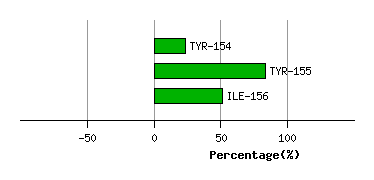
Graph shows rotational transition at bending residues and can be used
to identify hinge bending residues.
Probably only informative for interdomain rotations greater than 20 degrees
Residue
iResidue
i+1Distance of hinge axis to residue i in
(A) Distance of hinge axis to residue i in
(A) Change in
(deg) Change in
(deg) Angle of psi(i) axis to hinge axis
(deg) Angle of psi(i) axis to hinge axis
(deg) Percentage Progress
ASN-120
VAL-121
1.5
0.8
-36.8
22.2
64.5
45.5
16.8
VAL-121
THR-122
4.2
3.1
5.2
-11.7
145.4
131.2
0.3
THR-122
PRO-123
5.7
4.7
-3.9
1.7
41.2
34.0
1.0
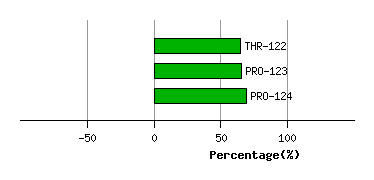
Graph shows rotational transition at bending residues and can be used
to identify hinge bending residues.
Probably only informative for interdomain rotations greater than 20 degrees