Glycogen Phosphorylase, Muscle Form
(All numbering and residues are taken from first PDB file)
![]()
![]()
Bending Residue Dihedral Analysis
Residue
iResidue
i+1Distance of hinge axis to residue i in
(A) Distance of hinge axis to residue i in
(A) Change in
(deg) Change in
(deg) Angle of psi(i) axis to hinge axis
(deg) Angle of psi(i) axis to hinge axis
(deg) Percentage Progress
PHE-163
GLY-164
10.1
9.4
17.5
-0.8
165.2
164.4
-173.7
GLY-164
ILE-165
9.8
9.7
-30.1
-12.4
72.0
88.2
103.7
ILE-165
PHE-166
11.7
12.9
-51.9
99.2
122.0
93.7
296.0
PHE-166
ASN-167
13.4
13.5
30.6
-46.7
113.1
114.9
-45.0
ASN-167
GLN-168
12.9
13.0
9.3
-4.8
97.0
100.4
10.0
GLN-168
LYS-169
16.2
16.3
16.4
-20.8
77.5
73.9
-14.5
LYS-169
ILE-170
18.7
18.5
-11.1
9.9
63.1
66.3
-32.9
ILE-170
SER-171
22.0
21.9
1.5
13.9
53.8
47.7
79.3
SER-171
GLY-172
25.1
24.6
-20.5
-9.2
70.2
64.5
289.8
GLY-172
GLY-173
28.6
27.9
21.3
1.0
154.8
138.7
-273.7
GLY-173
TRP-174
27.0
27.0
-4.2
-12.6
90.9
101.7
-109.2
TRP-174
GLN-175
25.7
25.9
-3.8
-10.0
104.9
110.9
-60.1
GLN-175
MET-176
22.3
22.4
-17.0
34.3
163.0
157.0
112.9
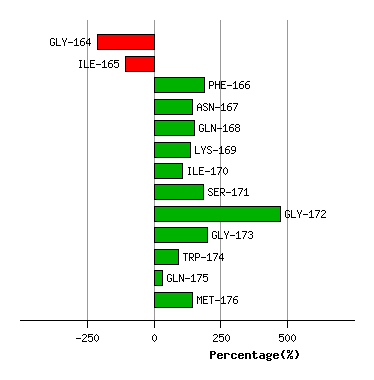
Graph shows rotational transition at bending residues and can be used
to identify hinge bending residues.
Probably only informative for interdomain rotations greater than 20 degrees
Residue
iResidue
i+1Distance of hinge axis to residue i in
(A) Distance of hinge axis to residue i in
(A) Change in
(deg) Change in
(deg) Angle of psi(i) axis to hinge axis
(deg) Angle of psi(i) axis to hinge axis
(deg) Percentage Progress
ASP-180
ASP-181
9.7
9.6
0.3
-16.1
125.9
120.4
213.3
ASP-181
TRP-182
7.4
6.8
30.1
-10.9
70.6
68.1
-65.9
TRP-182
LEU-183
4.3
4.2
-12.8
10.0
57.1
55.1
76.4
LEU-183
ARG-184
2.6
2.3
-3.1
0.7
35.6
26.5
8.1
ARG-184
TYR-185
3.1
2.8
19.1
-19.8
107.9
110.0
-56.3
TYR-185
GLY-186
2.9
2.4
14.3
-5.0
77.5
70.6
88.0
GLY-186
ASN-187
2.3
3.0
5.6
-5.4
12.3
11.5
28.5
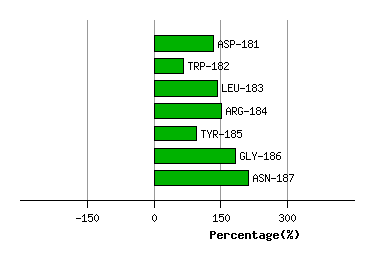
Graph shows rotational transition at bending residues and can be used
to identify hinge bending residues.
Probably only informative for interdomain rotations greater than 20 degrees
Residue
iResidue
i+1Distance of hinge axis to residue i in
(A) Distance of hinge axis to residue i in
(A) Change in
(deg) Change in
(deg) Angle of psi(i) axis to hinge axis
(deg) Angle of psi(i) axis to hinge axis
(deg) Percentage Progress
PRO-488
ARG-489
4.8
5.3
12.0
-18.8
48.0
42.2
-109.6
ARG-489
ARG-490
7.0
7.0
-11.4
13.0
121.6
124.1
75.6
ARG-490
TRP-491
4.4
4.6
4.6
-3.2
122.8
130.0
-56.1
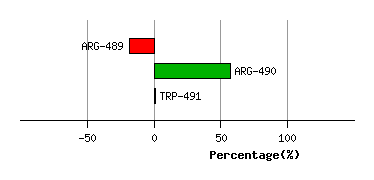
Graph shows rotational transition at bending residues and can be used
to identify hinge bending residues.
Probably only informative for interdomain rotations greater than 20 degrees
Residue
iResidue
i+1Distance of hinge axis to residue i in
(A) Distance of hinge axis to residue i in
(A) Change in
(deg) Change in
(deg) Angle of psi(i) axis to hinge axis
(deg) Angle of psi(i) axis to hinge axis
(deg) Percentage Progress
TYR-648
ARG-649
12.4
12.0
8.8
-8.6
107.2
106.3
35.6
ARG-649
VAL-650
8.7
8.3
10.2
-7.9
57.1
59.1
61.2
VAL-650
SER-651
5.2
4.9
5.6
-4.9
90.5
94.0
-24.9
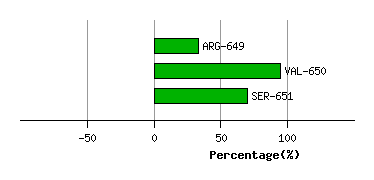
Graph shows rotational transition at bending residues and can be used
to identify hinge bending residues.
Probably only informative for interdomain rotations greater than 20 degrees
Residue
iResidue
i+1Distance of hinge axis to residue i in
(A) Distance of hinge axis to residue i in
(A) Change in
(deg) Change in
(deg) Angle of psi(i) axis to hinge axis
(deg) Angle of psi(i) axis to hinge axis
(deg) Percentage Progress
ALA-653
GLU-654
8.2
8.0
-0.7
-1.6
68.4
69.1
-35.1
GLU-654
LYS-655
7.2
7.4
-10.9
15.6
82.1
81.3
-26.9
LYS-655
VAL-656
11.0
11.1
11.2
-10.5
133.7
134.4
71.7
VAL-656
ILE-657
12.5
12.2
-5.1
-0.6
19.9
21.8
53.4
ILE-657
PRO-658
10.2
9.8
-4.2
27.4
55.7
60.8
-183.8
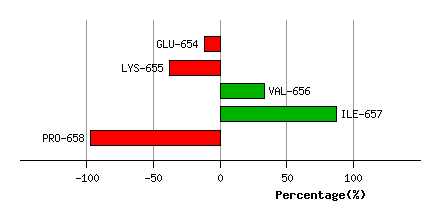
Graph shows rotational transition at bending residues and can be used
to identify hinge bending residues.
Probably only informative for interdomain rotations greater than 20 degrees
Residue
iResidue
i+1Distance of hinge axis to residue i in
(A) Distance of hinge axis to residue i in
(A) Change in
(deg) Change in
(deg) Angle of psi(i) axis to hinge axis
(deg) Angle of psi(i) axis to hinge axis
(deg) Percentage Progress
ALA-695
ASN-696
11.0
10.5
-12.8
-10.1
125.0
142.0
-252.8
ASN-696
VAL-697
11.2
11.1
4.3
-0.3
17.3
26.2
97.2
VAL-697
GLU-698
11.9
11.9
-12.3
4.8
107.9
101.6
-84.7
GLU-698
MET-699
9.0
9.0
8.6
-17.0
91.3
87.0
-42.2
MET-699
ALA-700
6.7
6.5
10.3
3.0
32.0
34.7
113.2
ALA-700
GLU-701
8.4
8.3
1.7
-12.1
39.5
42.2
-194.8
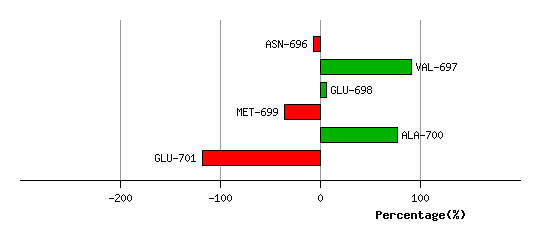
Graph shows rotational transition at bending residues and can be used
to identify hinge bending residues.
Probably only informative for interdomain rotations greater than 20 degrees
Residue
iResidue
i+1Distance of hinge axis to residue i in
(A) Distance of hinge axis to residue i in
(A) Change in
(deg) Change in
(deg) Angle of psi(i) axis to hinge axis
(deg) Angle of psi(i) axis to hinge axis
(deg) Percentage Progress
GLY-809
LYS-810
3.8
4.2
14.7
-11.4
103.0
100.4
7.5
LYS-810
PHE-811
5.3
5.3
0.6
-7.8
153.9
155.5
18.4
PHE-811
SER-812
4.3
4.3
1.2
-2.2
146.6
144.5
68.9
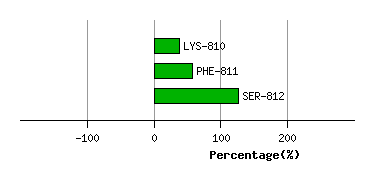
Graph shows rotational transition at bending residues and can be used
to identify hinge bending residues.
Probably only informative for interdomain rotations greater than 20 degrees