Amp-Dependent Protein Kinase, Alpha-Catalytic Subunit
(All numbering and residues are taken from first PDB file)
![]()
![]()
Bending Residue Dihedral Analysis
Residue
iResidue
i+1Distance of hinge axis to residue i in
(A) Distance of hinge axis to residue i in
(A) Change in
(deg) Change in
(deg) Angle of psi(i) axis to hinge axis
(deg) Angle of psi(i) axis to hinge axis
(deg) Percentage Progress
LYS-28
LYS-29
9.6
9.8
-4.6
-1.5
95.9
104.1
46.5
LYS-29
TRP-30
6.2
6.7
-2.3
5.1
58.7
63.1
-75.0
TRP-30
GLU-31
4.8
5.0
-12.7
2.0
22.7
21.1
78.7
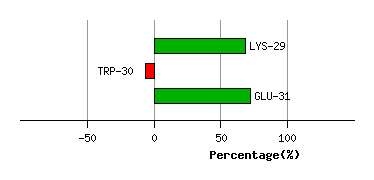
Graph shows rotational transition at bending residues and can be used
to identify hinge bending residues.
Probably only informative for interdomain rotations greater than 20 degrees
Residue
iResidue
i+1Distance of hinge axis to residue i in
(A) Distance of hinge axis to residue i in
(A) Change in
(deg) Change in
(deg) Angle of psi(i) axis to hinge axis
(deg) Angle of psi(i) axis to hinge axis
(deg) Percentage Progress
ALA-97
VAL-98
4.0
4.3
0.3
-20.0
133.4
130.5
21.5
VAL-98
ASN-99
5.9
6.0
-16.9
15.2
38.5
32.8
8.0
ASN-99
PHE-100
7.1
7.5
-12.9
7.8
59.6
49.7
62.8
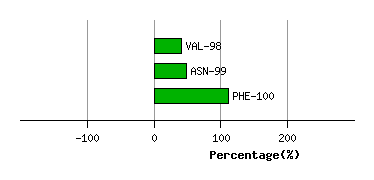
Graph shows rotational transition at bending residues and can be used
to identify hinge bending residues.
Probably only informative for interdomain rotations greater than 20 degrees
Residue
iResidue
i+1Distance of hinge axis to residue i in
(A) Distance of hinge axis to residue i in
(A) Change in
(deg) Change in
(deg) Angle of psi(i) axis to hinge axis
(deg) Angle of psi(i) axis to hinge axis
(deg) Percentage Progress
VAL-104
LYS-105
3.2
3.0
3.9
-6.8
136.6
132.2
28.8
LYS-105
LEU-106
0.5
0.8
-4.9
17.8
67.0
73.6
32.0
LEU-106
GLU-107
2.5
2.6
-20.1
22.2
89.7
92.9
-23.9
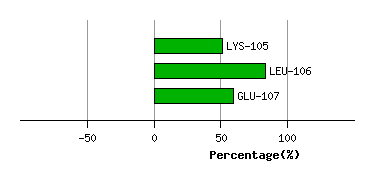
Graph shows rotational transition at bending residues and can be used
to identify hinge bending residues.
Probably only informative for interdomain rotations greater than 20 degrees
Residue
iResidue
i+1Distance of hinge axis to residue i in
(A) Distance of hinge axis to residue i in
(A) Change in
(deg) Change in
(deg) Angle of psi(i) axis to hinge axis
(deg) Angle of psi(i) axis to hinge axis
(deg) Percentage Progress
GLU-121
TYR-122
4.4
3.6
-15.7
7.1
54.9
53.9
147.8
TYR-122
VAL-123
5.7
5.2
-5.0
1.0
50.9
50.4
-18.5
VAL-123
ALA-124
4.5
4.0
-3.9
-4.0
50.4
49.4
-14.1
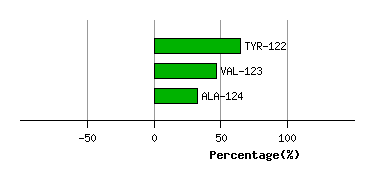
Graph shows rotational transition at bending residues and can be used
to identify hinge bending residues.
Probably only informative for interdomain rotations greater than 20 degrees
Residue
iResidue
i+1Distance of hinge axis to residue i in
(A) Distance of hinge axis to residue i in
(A) Change in
(deg) Change in
(deg) Angle of psi(i) axis to hinge axis
(deg) Angle of psi(i) axis to hinge axis
(deg) Percentage Progress
THR-183
ASP-184
8.5
8.2
5.3
0.5
136.5
140.0
-0.1
ASP-184
PHE-185
10.4
10.1
-6.0
-2.8
46.5
40.1
117.2
PHE-185
GLY-186
9.6
9.1
2.8
-16.3
141.2
149.7
38.2
GLY-186
PHE-187
12.0
11.2
5.5
2.8
47.6
64.5
36.1
GLY-186
PHE-187
12.0
11.2
5.5
2.8
47.6
64.5
36.1
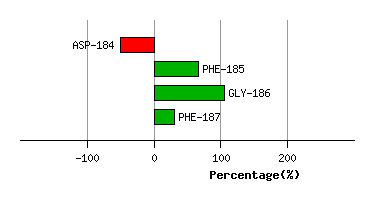
Graph shows rotational transition at bending residues and can be used
to identify hinge bending residues.
Probably only informative for interdomain rotations greater than 20 degrees
Residue
iResidue
i+1Distance of hinge axis to residue i in
(A) Distance of hinge axis to residue i in
(A) Change in
(deg) Change in
(deg) Angle of psi(i) axis to hinge axis
(deg) Angle of psi(i) axis to hinge axis
(deg) Percentage Progress
GLY-186
PHE-187
12.0
11.2
5.5
2.8
47.6
64.5
36.1
GLY-186
PHE-187
12.0
11.2
5.5
2.8
47.6
64.5
36.1
PHE-187
ALA-188
13.9
13.8
5.5
-10.5
74.1
77.3
-34.8
ALA-188
LYS-189
11.5
12.0
9.9
11.6
6.6
9.3
174.7
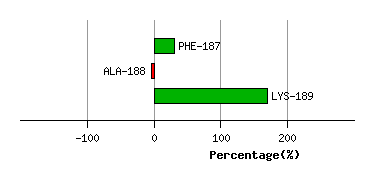
Graph shows rotational transition at bending residues and can be used
to identify hinge bending residues.
Probably only informative for interdomain rotations greater than 20 degrees
Residue
iResidue
i+1Distance of hinge axis to residue i in
(A) Distance of hinge axis to residue i in
(A) Change in
(deg) Change in
(deg) Angle of psi(i) axis to hinge axis
(deg) Angle of psi(i) axis to hinge axis
(deg) Percentage Progress
ILE-315
PRO-316
7.2
7.3
-9.2
24.9
103.7
103.4
-11.4
PRO-316
LYS-317
6.9
7.8
10.2
-41.0
75.3
63.8
-161.4
LYS-317
PHE-318
4.8
6.6
-51.7
18.7
65.9
84.1
-21.6
PHE-318
LYS-319
5.1
9.2
23.7
-28.3
44.7
54.2
31.3
LYS-319
GLY-320
7.8
10.8
-150.7
-86.4
79.7
62.1
-258.2
GLY-320
PRO-321
8.5
12.5
-73.8
9.5
0.7
71.8
446.8
PRO-321
GLY-322
8.9
11.5
-4.0
-48.4
70.8
45.3
235.0
GLY-322
ASP-323
10.8
13.0
102.4
165.1
62.6
100.4
-125.9
ASP-323
THR-324
10.6
14.7
-153.1
-173.7
53.8
107.6
-115.5
THR-324
SER-325
12.4
13.3
-151.1
-111.2
120.0
110.3
387.2
SER-325
ASN-326
12.9
16.4
-8.8
14.2
73.3
54.8
-65.6
ASN-326
PHE-327
12.0
16.0
-47.2
61.3
34.6
16.5
-81.9
PHE-327
ASP-328
14.3
14.7
144.5
-143.8
75.3
109.5
-140.6
ASP-328
ASP-329
18.0
18.1
-40.9
22.4
69.3
85.7
-81.7
ASP-329
TYR-330
20.3
20.7
-97.7
101.2
39.2
54.7
37.9
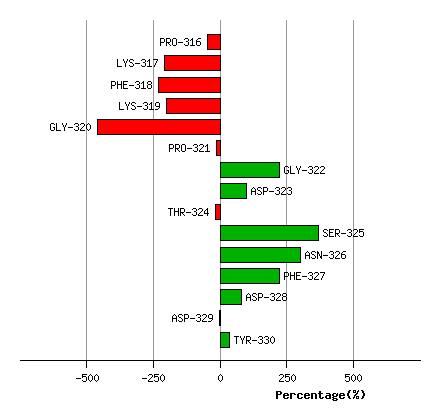
Graph shows rotational transition at bending residues and can be used
to identify hinge bending residues.
Probably only informative for interdomain rotations greater than 20 degrees