Ribonuclease Hi
(All numbering and residues are taken from first PDB file)
![]()
![]()
Bending Residue Dihedral Analysis
Residue
iResidue
i+1Distance of hinge axis to residue i in
(A) Distance of hinge axis to residue i in
(A) Change in
(deg) Change in
(deg) Angle of psi(i) axis to hinge axis
(deg) Angle of psi(i) axis to hinge axis
(deg) Percentage Progress
VAL-65
ILE-66
10.7
10.4
8.6
-0.8
64.9
69.5
16.1
ILE-66
LEU-67
7.7
7.3
8.3
-18.4
142.8
150.1
77.6
LEU-67
SER-68
5.3
5.4
0.7
15.4
75.7
85.1
20.6
SER-68
THR-69
4.4
4.1
16.1
-4.1
143.7
152.7
-110.2
THR-69
ASP-70
3.9
3.3
-14.9
16.5
107.4
105.1
-7.9
ASP-70
SER-71
6.0
5.9
-28.9
16.3
45.8
54.8
60.7
SER-71
GLN-72
5.4
5.2
1.6
-0.4
68.0
62.8
8.4
GLN-72
TYR-73
7.9
7.9
2.0
-1.7
121.8
120.6
10.6
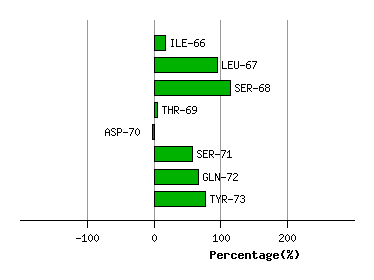
Graph shows rotational transition at bending residues and can be used
to identify hinge bending residues.
Probably only informative for interdomain rotations greater than 20 degrees
Residue
iResidue
i+1Distance of hinge axis to residue i in
(A) Distance of hinge axis to residue i in
(A) Change in
(deg) Change in
(deg) Angle of psi(i) axis to hinge axis
(deg) Angle of psi(i) axis to hinge axis
(deg) Percentage Progress
ASP-102
LEU-103
10.0
9.8
-4.4
-2.2
50.8
41.9
33.0
LEU-103
TRP-104
7.1
7.3
-11.0
7.5
20.7
27.2
54.3
TRP-104
GLN-105
8.9
9.1
-7.8
4.0
84.0
80.8
-15.0
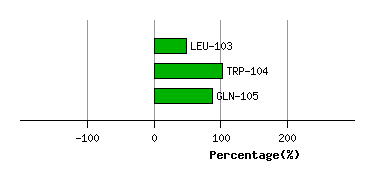
Graph shows rotational transition at bending residues and can be used
to identify hinge bending residues.
Probably only informative for interdomain rotations greater than 20 degrees
Residue
iResidue
i+1Distance of hinge axis to residue i in
(A) Distance of hinge axis to residue i in
(A) Change in
(deg) Change in
(deg) Angle of psi(i) axis to hinge axis
(deg) Angle of psi(i) axis to hinge axis
(deg) Percentage Progress
LYS-117
TRP-118
6.8
6.4
-6.8
3.7
62.0
61.4
20.8
TRP-118
GLU-119
3.5
3.2
-6.2
14.0
129.3
123.7
49.8
GLU-119
TRP-120
1.4
1.3
1.1
-5.2
124.1
128.5
15.5
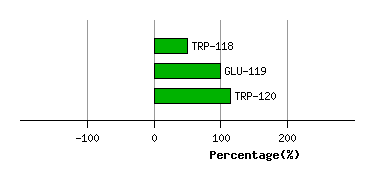
Graph shows rotational transition at bending residues and can be used
to identify hinge bending residues.
Probably only informative for interdomain rotations greater than 20 degrees
Residue
iResidue
i+1Distance of hinge axis to residue i in
(A) Distance of hinge axis to residue i in
(A) Change in
(deg) Change in
(deg) Angle of psi(i) axis to hinge axis
(deg) Angle of psi(i) axis to hinge axis
(deg) Percentage Progress
LYS-122
GLY-123
9.9
9.3
77.2
-101.5
73.3
43.4
-157.1
GLY-123
ALA-124
12.4
11.4
126.3
-48.1
94.6
99.9
-90.0
ALA-124
ALA-125
13.8
12.7
33.5
-31.8
154.9
157.7
-2.7
ALA-125
GLY-126
15.0
10.7
-75.5
164.7
56.6
93.3
-133.6
GLY-126
HIS-127
14.2
9.8
-130.2
-173.1
119.2
87.8
718.0
HIS-127
PRO-128
12.3
12.9
81.3
-23.3
39.6
129.9
-516.8
PRO-128
GLU-129
15.1
15.0
4.9
21.7
40.2
40.1
203.8
GLU-129
ASN-130
13.1
13.1
0.8
-0.7
50.4
52.4
-22.9
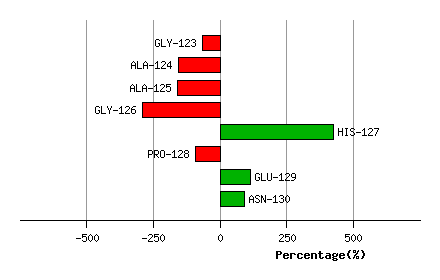
Graph shows rotational transition at bending residues and can be used
to identify hinge bending residues.
Probably only informative for interdomain rotations greater than 20 degrees