Pyruvate Kinase
(All numbering and residues are taken from first PDB file)
![]()
![]()
Bending Residue Dihedral Analysis
Residue
iResidue
i+1Distance of hinge axis to residue i in
(A) Distance of hinge axis to residue i in
(A) Change in
(deg) Change in
(deg) Angle of psi(i) axis to hinge axis
(deg) Angle of psi(i) axis to hinge axis
(deg) Percentage Progress
PRO-116
GLU-117
7.0
6.7
2.2
22.2
64.9
65.0
95.6
GLU-117
ILE-118
4.2
4.5
-14.8
-7.5
54.5
53.1
70.5
ILE-118
ARG-119
2.7
2.8
12.0
-18.1
58.2
54.2
-10.2
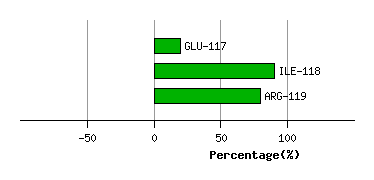
Graph shows rotational transition at bending residues and can be used
to identify hinge bending residues.
Probably only informative for interdomain rotations greater than 20 degrees
Residue
iResidue
i+1Distance of hinge axis to residue i in
(A) Distance of hinge axis to residue i in
(A) Change in
(deg) Change in
(deg) Angle of psi(i) axis to hinge axis
(deg) Angle of psi(i) axis to hinge axis
(deg) Percentage Progress
ASN-209
LEU-210
3.3
3.5
-1.8
2.9
110.2
117.2
-1.5
LEU-210
PRO-211
6.3
6.2
-6.5
0.2
72.2
72.4
76.8
PRO-211
GLY-212
8.3
8.3
5.7
-14.3
60.4
60.2
25.4
GLY-212
ALA-213
11.0
11.3
35.3
-48.8
169.0
168.5
136.4
GLY-212
ALA-213
11.0
11.3
35.3
-48.8
169.0
168.5
136.4
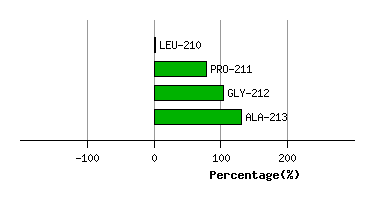
Graph shows rotational transition at bending residues and can be used
to identify hinge bending residues.
Probably only informative for interdomain rotations greater than 20 degrees
Residue
iResidue
i+1Distance of hinge axis to residue i in
(A) Distance of hinge axis to residue i in
(A) Change in
(deg) Change in
(deg) Angle of psi(i) axis to hinge axis
(deg) Angle of psi(i) axis to hinge axis
(deg) Percentage Progress
GLY-212
ALA-213
11.0
11.3
35.3
-48.8
169.0
168.5
136.4
GLY-212
ALA-213
11.0
11.3
35.3
-48.8
169.0
168.5
136.4
ALA-213
ALA-214
9.2
9.7
-4.7
16.5
68.1
69.7
-12.8
ALA-214
VAL-215
8.9
9.4
28.1
-11.8
117.9
113.9
-24.8
VAL-215
ASP-216
5.6
6.0
-51.3
50.9
75.0
57.5
17.2
ASP-216
LEU-217
6.9
6.7
-9.8
-13.2
88.8
96.2
-117.3
LEU-217
PRO-218
6.9
6.7
12.5
-18.9
84.9
81.5
-5.9
PRO-218
ALA-219
10.2
10.1
7.6
-4.2
21.1
18.5
19.4
ALA-219
VAL-220
12.3
12.4
-25.2
14.3
91.5
94.0
51.1
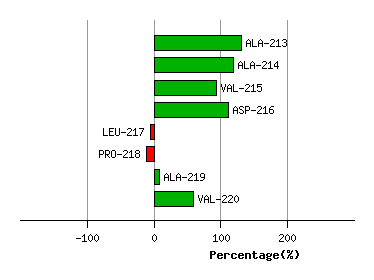
Graph shows rotational transition at bending residues and can be used
to identify hinge bending residues.
Probably only informative for interdomain rotations greater than 20 degrees