Vitamin D Hydroxylase
(All numbering and residues are taken from first PDB file)
![]()
![]()
Bending Residue Dihedral Analysis
Residue
iResidue
i+1Distance of hinge axis to residue i in
(A) Distance of hinge axis to residue i in
(A) Change in
(deg) Change in
(deg) Angle of psi(i) axis to hinge axis
(deg) Angle of psi(i) axis to hinge axis
(deg) Percentage Progress
THR-96
ARG-97
11.6
12.1
6.8
-5.5
97.2
94.6
10.1
ARG-97
LEU-98
10.7
11.3
5.6
-1.6
120.7
122.9
-22.8
LEU-98
ARG-99
7.1
7.9
-6.9
10.5
14.2
13.6
-39.7
ARG-99
LYS-100
7.7
8.6
-1.5
-6.2
58.8
61.9
53.0
LYS-100
LEU-101
10.7
11.7
-5.8
-4.4
77.7
73.9
8.2
LEU-101
VAL-102
9.3
10.6
-6.8
36.6
37.4
43.3
-150.0
VAL-102
GLY-103
6.4
7.4
-29.5
-5.0
32.5
26.6
211.8
GLY-103
ARG-104
8.1
9.2
17.5
-1.1
145.6
116.1
-106.9
ARG-104
SER-105
9.9
11.9
-8.1
-34.0
58.6
53.6
169.2
SER-105
PHE-106
7.2
10.1
-30.1
43.4
55.1
57.2
-72.8
PHE-106
THR-107
5.1
6.5
63.6
-37.0
126.9
124.7
-165.9
THR-107
VAL-108
8.1
8.2
5.6
-7.9
153.1
137.0
36.3
VAL-108
ARG-109
7.8
7.4
12.4
-5.8
122.3
138.5
-34.1
ARG-109
ARG-110
8.8
8.4
9.9
-4.1
78.2
88.9
-30.0
ARG-110
MET-111
7.2
6.7
2.6
9.7
108.3
105.4
-71.5
MET-111
ASN-112
3.5
3.2
-0.7
-21.4
8.5
7.6
148.7
ASN-112
GLU-113
4.4
4.1
8.0
-16.8
106.4
115.1
37.0
GLU-113
LEU-114
6.4
6.0
13.9
2.7
86.2
87.0
-14.3
LEU-114
GLU-115
4.6
4.6
-1.4
12.0
41.0
38.1
-69.3
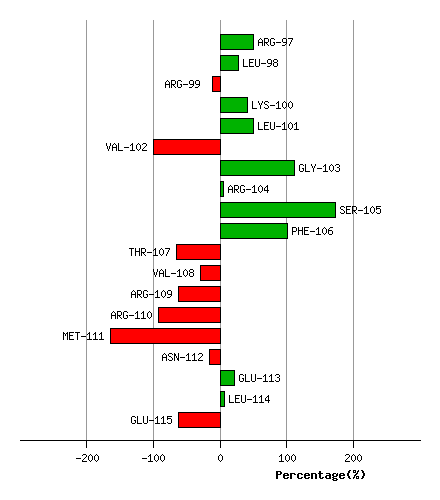
Graph shows rotational transition at bending residues and can be used
to identify hinge bending residues.
Probably only informative for interdomain rotations greater than 20 degrees
Residue
iResidue
i+1Distance of hinge axis to residue i in
(A) Distance of hinge axis to residue i in
(A) Change in
(deg) Change in
(deg) Angle of psi(i) axis to hinge axis
(deg) Angle of psi(i) axis to hinge axis
(deg) Percentage Progress
ILE-145
PRO-146
11.2
11.4
8.7
-1.5
40.0
41.0
40.5
PRO-146
VAL-147
9.2
9.5
7.9
-15.6
47.7
49.8
-17.5
VAL-147
GLN-148
11.3
11.1
10.7
-5.5
105.5
112.3
-2.3
GLN-148
VAL-149
11.6
11.4
3.8
-4.5
88.5
95.7
9.4
VAL-149
ILE-150
7.9
7.6
7.9
3.0
20.9
31.0
64.7
ILE-150
CYS-151
7.3
7.0
-3.4
3.9
114.2
103.0
-28.1
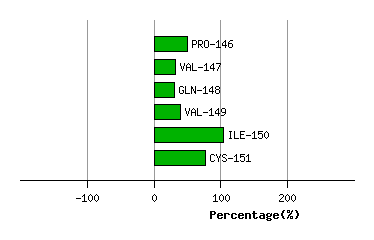
Graph shows rotational transition at bending residues and can be used
to identify hinge bending residues.
Probably only informative for interdomain rotations greater than 20 degrees
Residue
iResidue
i+1Distance of hinge axis to residue i in
(A) Distance of hinge axis to residue i in
(A) Change in
(deg) Change in
(deg) Angle of psi(i) axis to hinge axis
(deg) Angle of psi(i) axis to hinge axis
(deg) Percentage Progress
GLN-223
GLU-224
8.0
9.8
-14.6
14.8
96.6
88.7
-6.7
GLU-224
GLU-225
4.9
6.5
-10.7
0.2
137.6
133.3
-32.2
GLU-225
LEU-226
3.1
4.8
-3.0
0.1
150.5
159.9
-20.6
LEU-226
VAL-227
5.7
6.7
-0.8
-9.1
103.7
105.4
-33.2
VAL-227
ALA-228
6.3
6.8
15.9
-2.9
72.6
91.2
31.8
ALA-228
MET-229
3.6
3.5
-6.9
5.0
158.5
153.0
-10.5
MET-229
ALA-230
2.0
2.1
-1.0
1.9
132.1
137.8
0.4
ALA-230
MET-231
5.5
5.0
-4.2
1.9
93.4
89.2
5.6
MET-231
LEU-232
6.7
6.0
5.4
-4.4
56.2
70.6
-3.8
LEU-232
LEU-233
4.8
4.0
0.4
11.2
8.4
5.3
92.6
LEU-233
LEU-234
3.9
3.1
5.8
-11.7
67.6
66.2
-34.5
LEU-234
ILE-235
7.6
6.8
0.4
-2.0
81.1
96.9
-10.2
ILE-235
ALA-236
9.2
8.6
-1.8
-16.2
138.9
123.4
-74.4
ALA-236
GLY-237
7.6
7.6
9.9
-32.4
29.7
8.1
-133.6
GLY-237
HIS-238
7.7
6.7
9.9
14.1
75.3
62.4
71.5
HIS-238
GLU-239
11.5
9.9
-57.8
83.2
97.3
100.5
27.0
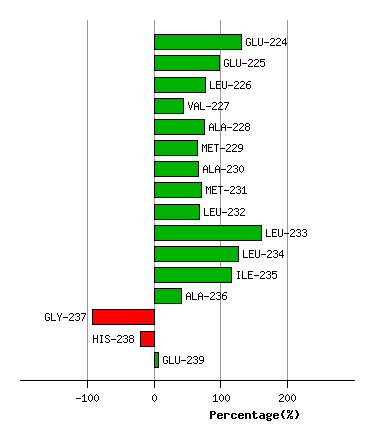
Graph shows rotational transition at bending residues and can be used
to identify hinge bending residues.
Probably only informative for interdomain rotations greater than 20 degrees