Spectinomycin Phosphotransferase
(All numbering and residues are taken from first PDB file)
![]()
![]()
Bending Residue Dihedral Analysis
Residue
iResidue
i+1Distance of hinge axis to residue i in
(A) Distance of hinge axis to residue i in
(A) Change in
(deg) Change in
(deg) Angle of psi(i) axis to hinge axis
(deg) Angle of psi(i) axis to hinge axis
(deg) Percentage Progress
LEU-53
LYS-54
15.0
15.1
-39.2
41.7
25.8
20.9
-27.7
LYS-54
TYR-55
15.3
14.4
28.0
-68.9
117.0
126.0
106.0
TYR-55
GLY-56
18.4
16.7
-133.0
172.6
38.6
22.6
-161.0
GLY-56
TYR-57
18.3
14.2
26.0
9.7
82.2
120.2
-36.4
TYR-57
HIS-58
17.9
13.3
-47.3
0.4
43.6
88.9
75.6
HIS-58
ASP-59
15.3
9.5
-153.5
15.5
114.6
152.3
-363.5
ASP-59
GLU-60
11.9
9.3
-156.4
11.8
93.9
91.8
256.8
GLU-60
ILE-61
9.3
9.7
-162.8
-17.2
77.4
61.4
278.7
ILE-61
ASN-62
5.9
7.0
8.2
-22.6
35.3
59.6
-49.9
ASN-62
LEU-63
4.4
4.4
10.7
2.1
63.2
37.1
41.5
LEU-63
SER-64
6.6
5.7
9.5
1.8
121.0
111.8
-24.3
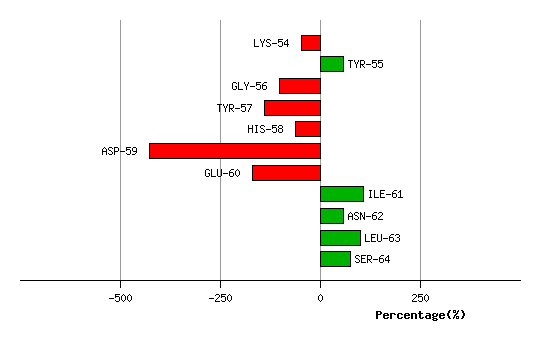
Graph shows rotational transition at bending residues and can be used
to identify hinge bending residues.
Probably only informative for interdomain rotations greater than 20 degrees
Residue
iResidue
i+1Distance of hinge axis to residue i in
(A) Distance of hinge axis to residue i in
(A) Change in
(deg) Change in
(deg) Angle of psi(i) axis to hinge axis
(deg) Angle of psi(i) axis to hinge axis
(deg) Percentage Progress
ILE-78
PHE-79
1.9
0.9
8.4
5.9
65.5
69.7
34.4
PHE-79
PRO-80
3.7
3.6
-22.6
5.3
57.8
63.6
65.1
PRO-80
ILE-81
5.7
5.7
4.1
-19.7
129.1
129.9
41.3
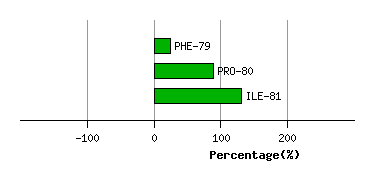
Graph shows rotational transition at bending residues and can be used
to identify hinge bending residues.
Probably only informative for interdomain rotations greater than 20 degrees
Residue
iResidue
i+1Distance of hinge axis to residue i in
(A) Distance of hinge axis to residue i in
(A) Change in
(deg) Change in
(deg) Angle of psi(i) axis to hinge axis
(deg) Angle of psi(i) axis to hinge axis
(deg) Percentage Progress
ALA-99
TYR-100
9.1
8.9
13.0
-9.8
84.1
90.8
-7.6
TYR-100
PRO-101
5.4
5.2
6.3
0.2
15.7
17.1
33.6
PRO-101
PHE-102
3.7
3.4
14.9
-6.1
91.5
91.8
-2.6
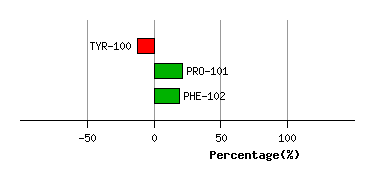
Graph shows rotational transition at bending residues and can be used
to identify hinge bending residues.
Probably only informative for interdomain rotations greater than 20 degrees