Aspartyl-Trna Synthetase
(All numbering and residues are taken from first PDB file)
![]()
![]()
Bending Residue Dihedral Analysis
Residue
iResidue
i+1Distance of hinge axis to residue i in
(A) Distance of hinge axis to residue i in
(A) Change in
(deg) Change in
(deg) Angle of psi(i) axis to hinge axis
(deg) Angle of psi(i) axis to hinge axis
(deg) Percentage Progress
PHE-1274
PRO-1275
3.3
2.8
-4.4
4.1
86.0
81.7
37.8
PRO-1275
ARG-1276
5.9
5.5
6.7
-4.5
35.8
38.5
38.1
ARG-1276
LEU-1277
8.0
8.0
18.0
-18.2
106.2
107.9
-23.9
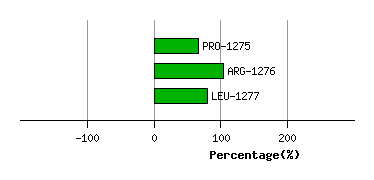
Graph shows rotational transition at bending residues and can be used
to identify hinge bending residues.
Probably only informative for interdomain rotations greater than 20 degrees
Residue
iResidue
i+1Distance of hinge axis to residue i in
(A) Distance of hinge axis to residue i in
(A) Change in
(deg) Change in
(deg) Angle of psi(i) axis to hinge axis
(deg) Angle of psi(i) axis to hinge axis
(deg) Percentage Progress
ALA-1282
MET-1283
14.6
14.8
2.3
-8.8
71.3
80.7
54.3
MET-1283
GLU-1284
18.1
18.3
14.4
-6.6
35.3
40.4
104.1
GLU-1284
ARG-1285
19.4
19.6
-21.8
12.8
148.6
152.0
-149.2
ARG-1285
TYR-1286
16.5
17.0
25.4
-24.6
71.6
78.6
41.0
TYR-1286
GLY-1287
15.6
16.6
5.4
-9.3
109.5
117.8
5.1
GLY-1287
SER-1288
18.7
19.6
8.2
-10.5
129.7
127.0
-17.9
SER-1288
ASP-1289
16.7
17.3
1.1
-4.3
133.1
121.5
0.5
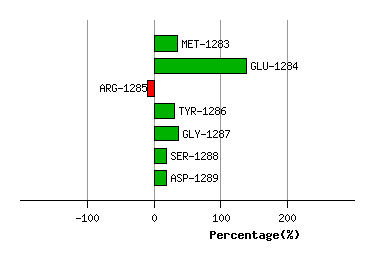
Graph shows rotational transition at bending residues and can be used
to identify hinge bending residues.
Probably only informative for interdomain rotations greater than 20 degrees
Residue
iResidue
i+1Distance of hinge axis to residue i in
(A) Distance of hinge axis to residue i in
(A) Change in
(deg) Change in
(deg) Angle of psi(i) axis to hinge axis
(deg) Angle of psi(i) axis to hinge axis
(deg) Percentage Progress
LYS-1290
PRO-1291
12.5
12.8
7.9
-3.3
9.2
2.8
77.4
PRO-1291
ASP-1292
11.6
12.0
1.0
1.1
65.6
63.2
35.2
ASP-1292
LEU-1293
10.1
11.0
-12.6
6.4
129.1
130.1
-72.7
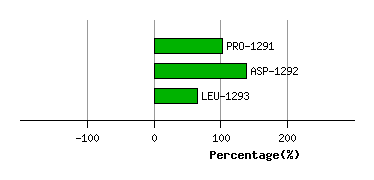
Graph shows rotational transition at bending residues and can be used
to identify hinge bending residues.
Probably only informative for interdomain rotations greater than 20 degrees
Residue
iResidue
i+1Distance of hinge axis to residue i in
(A) Distance of hinge axis to residue i in
(A) Change in
(deg) Change in
(deg) Angle of psi(i) axis to hinge axis
(deg) Angle of psi(i) axis to hinge axis
(deg) Percentage Progress
GLY-1296
LEU-1297
9.9
10.9
-20.6
20.9
96.4
95.5
-46.6
LEU-1297
GLU-1298
13.6
14.6
-21.4
17.0
144.3
143.4
-46.8
GLU-1298
LEU-1299
14.9
15.4
-1.9
1.5
83.1
86.2
-24.3
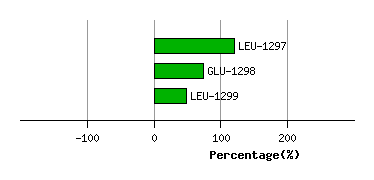
Graph shows rotational transition at bending residues and can be used
to identify hinge bending residues.
Probably only informative for interdomain rotations greater than 20 degrees
Residue
iResidue
i+1Distance of hinge axis to residue i in
(A) Distance of hinge axis to residue i in
(A) Change in
(deg) Change in
(deg) Angle of psi(i) axis to hinge axis
(deg) Angle of psi(i) axis to hinge axis
(deg) Percentage Progress
ARG-1415
GLU-1416
9.2
9.8
2.0
3.4
111.7
105.0
-43.5
GLU-1416
GLY-1417
8.3
8.7
-2.9
-26.2
52.3
41.1
322.3
GLY-1417
PHE-1418
6.9
7.7
10.6
4.4
155.4
146.4
-177.2
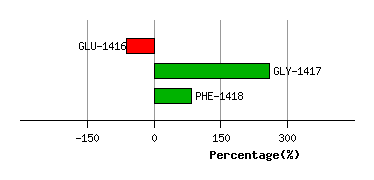
Graph shows rotational transition at bending residues and can be used
to identify hinge bending residues.
Probably only informative for interdomain rotations greater than 20 degrees
Residue
iResidue
i+1Distance of hinge axis to residue i in
(A) Distance of hinge axis to residue i in
(A) Change in
(deg) Change in
(deg) Angle of psi(i) axis to hinge axis
(deg) Angle of psi(i) axis to hinge axis
(deg) Percentage Progress
PHE-1420
LEU-1421
3.0
3.6
-3.9
6.9
96.4
97.6
-19.7
LEU-1421
TRP-1422
4.2
4.8
-7.0
11.3
156.4
159.8
45.9
TRP-1422
VAL-1423
5.8
5.9
-9.0
6.9
84.2
85.4
-9.2
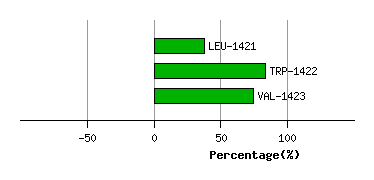
Graph shows rotational transition at bending residues and can be used
to identify hinge bending residues.
Probably only informative for interdomain rotations greater than 20 degrees
Residue
iResidue
i+1Distance of hinge axis to residue i in
(A) Distance of hinge axis to residue i in
(A) Change in
(deg) Change in
(deg) Angle of psi(i) axis to hinge axis
(deg) Angle of psi(i) axis to hinge axis
(deg) Percentage Progress
PHE-1445
THR-1446
12.1
12.1
-1.2
2.4
134.0
129.6
-27.0
THR-1446
SER-1447
11.9
11.8
0.9
-3.1
103.5
107.0
25.5
SER-1447
PRO-1448
12.3
12.3
4.7
2.8
46.5
49.8
72.4
PRO-1448
HIS-1449
15.5
15.6
-5.3
2.2
101.3
103.9
-53.3

Graph shows rotational transition at bending residues and can be used
to identify hinge bending residues.
Probably only informative for interdomain rotations greater than 20 degrees
Residue
iResidue
i+1Distance of hinge axis to residue i in
(A) Distance of hinge axis to residue i in
(A) Change in
(deg) Change in
(deg) Angle of psi(i) axis to hinge axis
(deg) Angle of psi(i) axis to hinge axis
(deg) Percentage Progress
LEU-1466
ALA-1467
11.3
11.2
-15.3
20.7
103.5
107.2
63.7
ALA-1467
TYR-1468
10.0
10.2
13.7
-21.3
18.0
23.5
-100.3
TYR-1468
ASP-1469
8.1
8.4
-3.7
4.4
108.3
104.9
24.1
ASP-1469
LEU-1470
8.2
8.6
5.3
0.6
45.4
48.3
-23.5
LEU-1470
VAL-1471
5.9
6.3
5.5
-3.7
48.3
46.7
-28.2
VAL-1471
LEU-1472
7.6
8.0
1.1
-2.2
43.5
40.4
22.3
LEU-1472
ASN-1473
7.5
8.0
2.9
-7.6
43.2
47.5
22.1
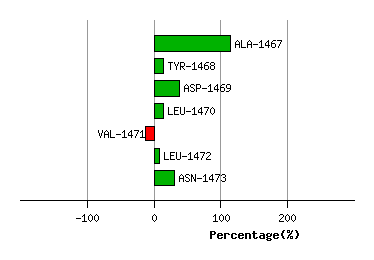
Graph shows rotational transition at bending residues and can be used
to identify hinge bending residues.
Probably only informative for interdomain rotations greater than 20 degrees
Residue
iResidue
i+1Distance of hinge axis to residue i in
(A) Distance of hinge axis to residue i in
(A) Change in
(deg) Change in
(deg) Angle of psi(i) axis to hinge axis
(deg) Angle of psi(i) axis to hinge axis
(deg) Percentage Progress
GLY-1474
VAL-1475
11.5
12.1
6.2
-0.8
40.5
41.7
27.2
VAL-1475
GLU-1476
12.4
12.9
0.9
-1.4
32.4
38.1
-14.5
GLU-1476
VAL-1477
11.5
11.8
-5.8
2.8
113.7
113.6
-27.9
VAL-1477
GLY-1478
10.2
10.4
11.9
-2.4
159.3
154.5
-102.4
VAL-1477
GLY-1478
10.2
10.4
11.9
-2.4
159.3
154.5
-102.4
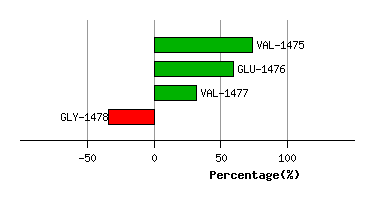
Graph shows rotational transition at bending residues and can be used
to identify hinge bending residues.
Probably only informative for interdomain rotations greater than 20 degrees
Residue
iResidue
i+1Distance of hinge axis to residue i in
(A) Distance of hinge axis to residue i in
(A) Change in
(deg) Change in
(deg) Angle of psi(i) axis to hinge axis
(deg) Angle of psi(i) axis to hinge axis
(deg) Percentage Progress
VAL-1477
GLY-1478
10.2
10.4
11.9
-2.4
159.3
154.5
-102.4
VAL-1477
GLY-1478
10.2
10.4
11.9
-2.4
159.3
154.5
-102.4
GLY-1478
GLY-1479
8.5
8.8
-10.2
12.7
71.8
68.6
-19.5
GLY-1479
GLY-1480
8.1
8.8
-12.8
7.8
17.8
23.4
59.8
GLY-1480
SER-1481
6.9
7.1
1.1
-9.0
103.2
104.2
11.8
SER-1481
ILE-1482
7.2
7.3
-6.8
4.0
35.5
34.9
60.2
ILE-1482
ARG-1483
6.9
6.9
2.0
0.1
47.4
45.3
-2.2
ILE-1482
ARG-1483
6.9
6.9
2.0
0.1
47.4
45.3
-2.2
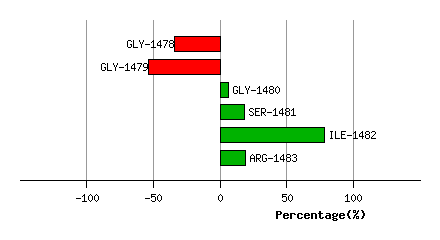
Graph shows rotational transition at bending residues and can be used
to identify hinge bending residues.
Probably only informative for interdomain rotations greater than 20 degrees
Residue
iResidue
i+1Distance of hinge axis to residue i in
(A) Distance of hinge axis to residue i in
(A) Change in
(deg) Change in
(deg) Angle of psi(i) axis to hinge axis
(deg) Angle of psi(i) axis to hinge axis
(deg) Percentage Progress
ILE-1482
ARG-1483
6.9
6.9
2.0
0.1
47.4
45.3
-2.2
ILE-1482
ARG-1483
6.9
6.9
2.0
0.1
47.4
45.3
-2.2
ARG-1483
ILE-1484
7.7
7.9
2.0
4.4
51.3
50.8
55.9
ILE-1484
HIS-1485
10.1
10.2
8.4
-8.7
34.9
40.5
-65.0
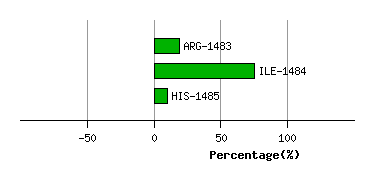
Graph shows rotational transition at bending residues and can be used
to identify hinge bending residues.
Probably only informative for interdomain rotations greater than 20 degrees
Residue
iResidue
i+1Distance of hinge axis to residue i in
(A) Distance of hinge axis to residue i in
(A) Change in
(deg) Change in
(deg) Angle of psi(i) axis to hinge axis
(deg) Angle of psi(i) axis to hinge axis
(deg) Percentage Progress
GLY-1509
PHE-1510
15.3
15.2
2.4
7.6
101.7
96.7
26.0
PHE-1510
PHE-1511
12.6
12.5
-8.6
3.7
124.4
126.5
-45.7
PHE-1511
LEU-1512
10.6
10.8
-0.1
-4.1
77.5
78.3
70.5
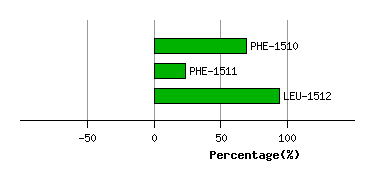
Graph shows rotational transition at bending residues and can be used
to identify hinge bending residues.
Probably only informative for interdomain rotations greater than 20 degrees