O-Methyltransferase
(All numbering and residues are taken from first PDB file)
![]()
![]()
Bending Residue Dihedral Analysis
Residue
iResidue
i+1Distance of hinge axis to residue i in
(A) Distance of hinge axis to residue i in
(A) Change in
(deg) Change in
(deg) Angle of psi(i) axis to hinge axis
(deg) Angle of psi(i) axis to hinge axis
(deg) Percentage Progress
GLU-100
GLY-101
7.2
6.6
-11.5
-1.7
63.2
53.3
55.7
GLY-101
PRO-102
4.9
4.7
-14.8
4.0
21.5
26.6
201.5
PRO-102
VAL-103
6.1
6.3
15.8
-0.6
135.0
136.4
-191.7
VAL-103
ALA-104
3.1
3.1
-0.5
-6.8
94.7
95.0
-18.7
VAL-103
ALA-104
3.1
3.1
-0.5
-6.8
94.7
95.0
-18.7
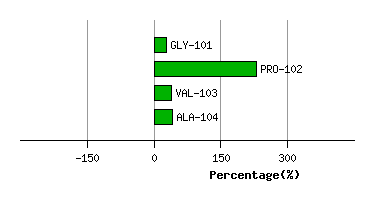
Graph shows rotational transition at bending residues and can be used
to identify hinge bending residues.
Probably only informative for interdomain rotations greater than 20 degrees
Residue
iResidue
i+1Distance of hinge axis to residue i in
(A) Distance of hinge axis to residue i in
(A) Change in
(deg) Change in
(deg) Angle of psi(i) axis to hinge axis
(deg) Angle of psi(i) axis to hinge axis
(deg) Percentage Progress
VAL-103
ALA-104
3.1
3.1
-0.5
-6.8
94.7
95.0
-18.7
VAL-103
ALA-104
3.1
3.1
-0.5
-6.8
94.7
95.0
-18.7
ALA-104
ARG-105
4.7
4.6
-9.9
7.8
97.2
96.3
65.0
ARG-105
GLY-106
7.7
7.6
2.4
-0.4
14.5
15.0
-11.4
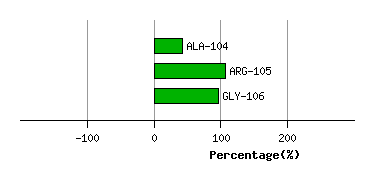
Graph shows rotational transition at bending residues and can be used
to identify hinge bending residues.
Probably only informative for interdomain rotations greater than 20 degrees
Residue
iResidue
i+1Distance of hinge axis to residue i in
(A) Distance of hinge axis to residue i in
(A) Change in
(deg) Change in
(deg) Angle of psi(i) axis to hinge axis
(deg) Angle of psi(i) axis to hinge axis
(deg) Percentage Progress
ALA-144
ALA-145
11.4
11.7
-13.4
5.6
94.4
90.9
-11.6
ALA-145
PHE-146
7.6
7.9
-5.4
7.4
27.6
27.7
13.2
PHE-146
ASP-147
7.6
7.8
-0.6
-4.2
84.7
86.3
18.3
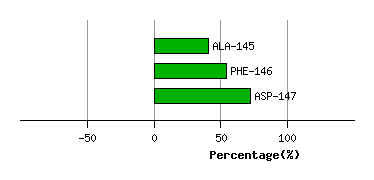
Graph shows rotational transition at bending residues and can be used
to identify hinge bending residues.
Probably only informative for interdomain rotations greater than 20 degrees
Residue
iResidue
i+1Distance of hinge axis to residue i in
(A) Distance of hinge axis to residue i in
(A) Change in
(deg) Change in
(deg) Angle of psi(i) axis to hinge axis
(deg) Angle of psi(i) axis to hinge axis
(deg) Percentage Progress
LEU-276
VAL-277
10.1
9.8
4.3
0.0
74.7
74.9
7.4
VAL-277
GLU-278
8.7
8.5
8.4
-27.9
32.0
36.4
-250.4
GLU-278
GLU-279
11.2
11.2
-40.3
30.5
132.2
120.6
205.4
GLU-279
GLY-280
10.9
10.6
-148.0
-146.5
82.9
79.7
-313.6
GLY-280
ALA-281
12.3
13.9
-55.5
-115.1
61.2
13.8
2154.2
ALA-281
GLY-282
15.3
13.6
-29.1
62.3
46.7
56.5
-200.9
GLY-282
GLY-283
14.8
16.5
-41.8
59.6
64.0
41.5
-441.8
GLY-283
PRO-284
17.3
17.4
28.3
0.1
152.1
131.9
-632.5
PRO-284
GLY-285
17.2
15.6
-172.3
-136.7
76.2
94.4
9.5
GLY-285
ALA-286
13.7
13.7
-67.1
1.8
137.0
121.8
-440.8
ALA-286
ALA-287
12.1
11.8
2.4
-6.9
105.9
108.1
3.1
ALA-287
GLY-288
12.1
11.7
-3.3
11.4
46.9
44.8
-22.8
GLY-288
LEU-289
9.9
9.8
-5.1
1.4
112.8
111.8
-31.6
LEU-289
ALA-290
7.6
7.4
3.5
0.1
61.8
62.3
31.3
LEU-289
ALA-290
7.6
7.4
3.5
0.1
61.8
62.3
31.3
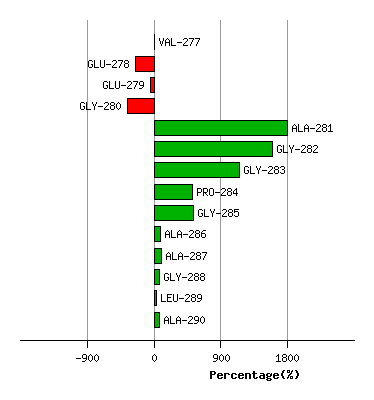
Graph shows rotational transition at bending residues and can be used
to identify hinge bending residues.
Probably only informative for interdomain rotations greater than 20 degrees
Residue
iResidue
i+1Distance of hinge axis to residue i in
(A) Distance of hinge axis to residue i in
(A) Change in
(deg) Change in
(deg) Angle of psi(i) axis to hinge axis
(deg) Angle of psi(i) axis to hinge axis
(deg) Percentage Progress
LEU-289
ALA-290
7.6
7.4
3.5
0.1
61.8
62.3
31.3
LEU-289
ALA-290
7.6
7.4
3.5
0.1
61.8
62.3
31.3
ALA-290
GLU-291
7.1
6.9
-5.0
2.5
47.6
49.2
11.9
GLU-291
LEU-292
7.3
7.0
-6.1
3.5
74.3
75.4
30.3
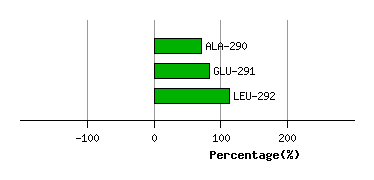
Graph shows rotational transition at bending residues and can be used
to identify hinge bending residues.
Probably only informative for interdomain rotations greater than 20 degrees
Residue
iResidue
i+1Distance of hinge axis to residue i in
(A) Distance of hinge axis to residue i in
(A) Change in
(deg) Change in
(deg) Angle of psi(i) axis to hinge axis
(deg) Angle of psi(i) axis to hinge axis
(deg) Percentage Progress
VAL-299
TYR-300
7.4
7.5
-1.4
4.9
68.4
67.2
9.0
TYR-300
GLY-301
7.4
7.7
16.8
-18.4
165.7
159.2
29.7
GLY-301
GLY-302
8.2
8.5
17.3
-7.5
116.1
121.1
-14.1
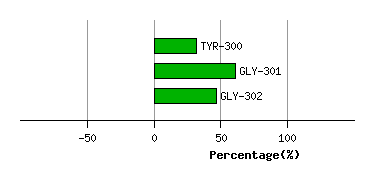
Graph shows rotational transition at bending residues and can be used
to identify hinge bending residues.
Probably only informative for interdomain rotations greater than 20 degrees