Glutamate Dehydrogenase 1
(All numbering and residues are taken from first PDB file)
![]()
![]()
Bending Residue Dihedral Analysis
Residue
iResidue
i+1Distance of hinge axis to residue i in
(A) Distance of hinge axis to residue i in
(A) Change in
(deg) Change in
(deg) Angle of psi(i) axis to hinge axis
(deg) Angle of psi(i) axis to hinge axis
(deg) Percentage Progress
PHE-20
PHE-21
7.5
7.9
4.6
-0.3
90.3
91.5
-0.7
PHE-21
ASP-22
6.5
6.2
19.6
-13.8
25.7
25.8
22.7
ASP-22
ARG-23
7.0
6.5
6.5
-18.5
66.3
64.9
15.4
ARG-23
GLY-24
4.4
4.3
22.9
6.3
106.4
118.0
-43.6
GLY-24
ALA-25
1.6
1.7
-13.3
-1.1
100.2
113.5
-4.9
ALA-25
SER-26
4.7
3.7
-3.4
12.8
150.8
154.2
83.0
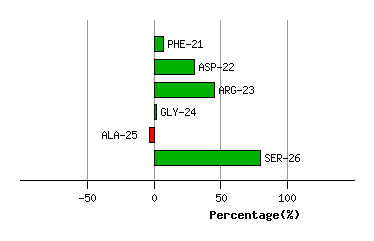
Graph shows rotational transition at bending residues and can be used
to identify hinge bending residues.
Probably only informative for interdomain rotations greater than 20 degrees
Residue
iResidue
i+1Distance of hinge axis to residue i in
(A) Distance of hinge axis to residue i in
(A) Change in
(deg) Change in
(deg) Angle of psi(i) axis to hinge axis
(deg) Angle of psi(i) axis to hinge axis
(deg) Percentage Progress
GLY-210
GLY-211
6.5
6.4
2.9
-0.3
141.7
146.4
-5.4
GLY-211
ILE-212
6.4
6.8
4.5
-6.9
87.7
89.2
10.1
ILE-212
HIS-213
4.4
5.2
8.2
22.8
90.3
94.8
0.2
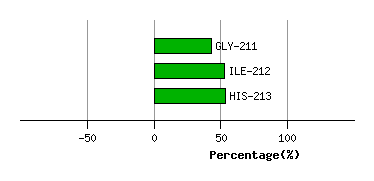
Graph shows rotational transition at bending residues and can be used
to identify hinge bending residues.
Probably only informative for interdomain rotations greater than 20 degrees
Residue
iResidue
i+1Distance of hinge axis to residue i in
(A) Distance of hinge axis to residue i in
(A) Change in
(deg) Change in
(deg) Angle of psi(i) axis to hinge axis
(deg) Angle of psi(i) axis to hinge axis
(deg) Percentage Progress
ALA-379
GLY-380
6.3
6.4
-18.9
6.5
25.0
17.1
72.6
GLY-380
GLY-381
7.3
7.8
5.1
0.1
135.8
132.1
-22.4
GLY-381
VAL-382
7.3
7.8
-10.5
-3.0
87.9
78.7
41.9
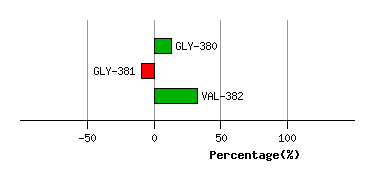
Graph shows rotational transition at bending residues and can be used
to identify hinge bending residues.
Probably only informative for interdomain rotations greater than 20 degrees
Residue
iResidue
i+1Distance of hinge axis to residue i in
(A) Distance of hinge axis to residue i in
(A) Change in
(deg) Change in
(deg) Angle of psi(i) axis to hinge axis
(deg) Angle of psi(i) axis to hinge axis
(deg) Percentage Progress
THR-460
MET-461
8.1
8.3
11.1
-13.4
139.1
138.4
-1.2
MET-461
GLU-462
9.3
9.6
4.0
0.8
126.1
127.7
-32.4
GLU-462
ARG-463
12.3
12.6
9.4
-3.5
124.1
126.0
-26.8
ARG-463
SER-464
11.5
11.3
-18.1
6.4
40.0
37.5
93.5
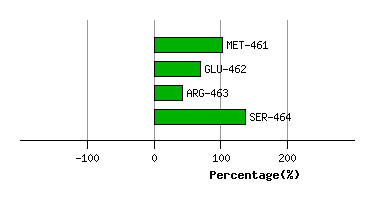
Graph shows rotational transition at bending residues and can be used
to identify hinge bending residues.
Probably only informative for interdomain rotations greater than 20 degrees
Residue
iResidue
i+1Distance of hinge axis to residue i in
(A) Distance of hinge axis to residue i in
(A) Change in
(deg) Change in
(deg) Angle of psi(i) axis to hinge axis
(deg) Angle of psi(i) axis to hinge axis
(deg) Percentage Progress
ILE-468
MET-469
8.5
8.7
-5.0
2.0
46.6
46.9
26.2
MET-469
ARG-470
12.0
12.3
5.4
-0.8
126.2
126.8
-39.3
ARG-470
THR-471
12.5
12.6
-19.1
22.5
45.9
43.2
-27.5
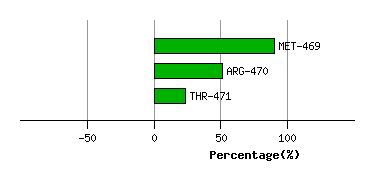
Graph shows rotational transition at bending residues and can be used
to identify hinge bending residues.
Probably only informative for interdomain rotations greater than 20 degrees
Residue
iResidue
i+1Distance of hinge axis to residue i in
(A) Distance of hinge axis to residue i in
(A) Change in
(deg) Change in
(deg) Angle of psi(i) axis to hinge axis
(deg) Angle of psi(i) axis to hinge axis
(deg) Percentage Progress
ARG-482
THR-483
7.9
7.7
7.2
7.6
64.3
62.3
42.5
THR-483
ALA-484
5.2
5.1
-11.3
8.4
75.9
69.2
-8.6
ALA-484
ALA-485
5.7
5.6
-9.1
3.6
31.9
33.6
21.9
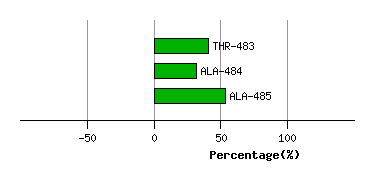
Graph shows rotational transition at bending residues and can be used
to identify hinge bending residues.
Probably only informative for interdomain rotations greater than 20 degrees