Alcohol Dehydrogenase E Chain
(All numbering and residues are taken from first PDB file)
![]()
![]()
Bending Residue Dihedral Analysis
Residue
iResidue
i+1Distance of hinge axis to residue i in
(A) Distance of hinge axis to residue i in
(A) Change in
(deg) Change in
(deg) Angle of psi(i) axis to hinge axis
(deg) Angle of psi(i) axis to hinge axis
(deg) Percentage Progress
GLY-175
PHE-176
4.4
4.5
-8.0
-0.9
99.6
101.2
-35.1
PHE-176
SER-177
4.2
4.1
-2.6
5.4
163.0
162.3
40.5
SER-177
THR-178
3.1
3.1
5.5
-6.5
48.4
48.7
7.2
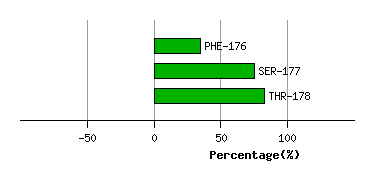
Graph shows rotational transition at bending residues and can be used
to identify hinge bending residues.
Probably only informative for interdomain rotations greater than 20 degrees
Residue
iResidue
i+1Distance of hinge axis to residue i in
(A) Distance of hinge axis to residue i in
(A) Change in
(deg) Change in
(deg) Angle of psi(i) axis to hinge axis
(deg) Angle of psi(i) axis to hinge axis
(deg) Percentage Progress
ALA-317
ILE-318
6.5
6.4
10.6
-9.5
37.6
39.5
19.7
ILE-318
PHE-319
5.2
5.1
4.1
-4.1
64.1
64.3
69.6
PHE-319
GLY-320
2.6
2.4
5.1
-5.9
104.2
103.3
-4.3
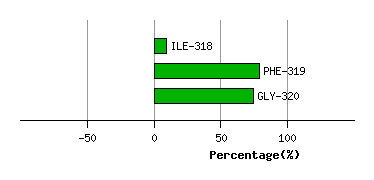
Graph shows rotational transition at bending residues and can be used
to identify hinge bending residues.
Probably only informative for interdomain rotations greater than 20 degrees
Residue
iResidue
i+1Distance of hinge axis to residue i in
(A) Distance of hinge axis to residue i in
(A) Change in
(deg) Change in
(deg) Angle of psi(i) axis to hinge axis
(deg) Angle of psi(i) axis to hinge axis
(deg) Percentage Progress
ALA-333
ASP-334
13.2
13.2
-4.7
7.9
82.0
79.0
-42.7
ASP-334
PHE-335
12.8
12.9
-2.0
-4.9
29.0
21.3
54.2
PHE-335
MET-336
10.6
10.9
3.3
-8.4
135.2
130.9
21.3
MET-336
ALA-337
13.1
13.4
5.6
5.8
92.2
91.0
-8.0
ALA-337
LYS-338
15.8
16.2
-11.2
1.5
79.2
64.2
-5.0
LYS-338
LYS-339
14.5
14.9
3.6
1.1
41.8
50.4
-0.2
LYS-339
PHE-340
14.4
14.8
-5.7
-0.6
90.7
84.6
1.5
PHE-340
ALA-341
11.7
12.1
-6.0
3.5
28.8
35.0
9.5
ALA-341
LEU-342
9.9
10.2
0.2
3.4
82.1
81.1
6.4
LEU-342
ASP-343
6.3
6.5
8.7
-0.3
145.6
143.3
-57.0
ASP-343
PRO-344
6.7
6.6
-7.2
8.5
95.1
91.7
34.9
PRO-344
LEU-345
9.3
9.3
-8.4
-0.2
109.3
111.7
-18.0
LEU-345
ILE-346
7.3
7.2
4.6
-1.0
134.1
125.7
18.8
ILE-346
THR-347
5.3
5.1
-2.1
1.8
38.9
36.4
9.6
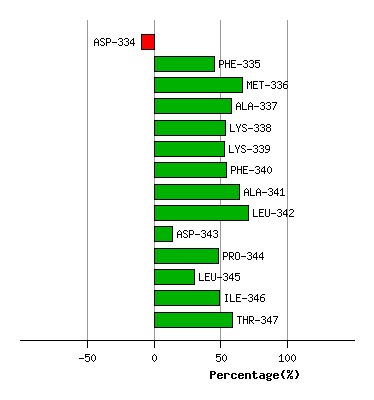
Graph shows rotational transition at bending residues and can be used
to identify hinge bending residues.
Probably only informative for interdomain rotations greater than 20 degrees