Glutamate Receptor 2
(All numbering and residues are taken from first PDB file)
![]()
![]()
Bending Residue Dihedral Analysis
Residue
iResidue
i+1Distance of hinge axis to residue i in
(A) Distance of hinge axis to residue i in
(A) Change in
(deg) Change in
(deg) Angle of psi(i) axis to hinge axis
(deg) Angle of psi(i) axis to hinge axis
(deg) Percentage Progress
PRO-632
ILE-633
13.3
13.2
87.5
-79.1
157.6
160.2
-84.2
ILE-633
GLU-634
11.7
11.5
10.0
5.4
108.7
110.2
-27.6
GLU-634
SER-635
9.9
10.0
10.1
-48.8
167.5
154.0
195.5
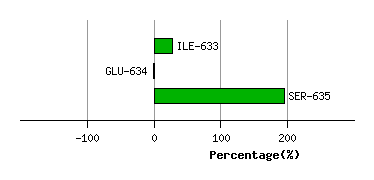
Graph shows rotational transition at bending residues and can be used
to identify hinge bending residues.
Probably only informative for interdomain rotations greater than 20 degrees
Residue
iResidue
i+1Distance of hinge axis to residue i in
(A) Distance of hinge axis to residue i in
(A) Change in
(deg) Change in
(deg) Angle of psi(i) axis to hinge axis
(deg) Angle of psi(i) axis to hinge axis
(deg) Percentage Progress
GLU-688
GLY-689
15.6
15.3
-4.3
-13.7
105.9
105.1
-66.2
GLY-689
VAL-690
13.3
12.9
3.0
-15.5
124.6
124.8
42.1
VAL-690
ALA-691
10.3
10.0
-9.4
-12.7
46.8
21.8
121.5
ALA-691
ARG-692
12.5
11.7
12.1
3.9
89.2
91.0
-15.5
ARG-692
VAL-693
13.6
13.0
3.5
-14.7
91.6
90.4
13.4
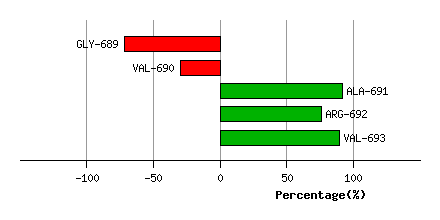
Graph shows rotational transition at bending residues and can be used
to identify hinge bending residues.
Probably only informative for interdomain rotations greater than 20 degrees
Residue
iResidue
i+1Distance of hinge axis to residue i in
(A) Distance of hinge axis to residue i in
(A) Change in
(deg) Change in
(deg) Angle of psi(i) axis to hinge axis
(deg) Angle of psi(i) axis to hinge axis
(deg) Percentage Progress
LYS-697
GLY-698
12.2
12.0
0.8
-8.9
134.0
138.8
28.2
GLY-698
LYS-699
11.8
11.4
2.3
6.6
127.4
127.6
-16.7
LYS-699
TYR-700
14.9
14.6
-0.2
-6.0
45.4
42.2
42.1
TYR-700
ALA-701
13.5
13.2
8.4
-0.2
117.0
112.1
-86.9
ALA-701
TYR-702
10.9
10.5
-8.8
13.7
49.2
54.7
21.1
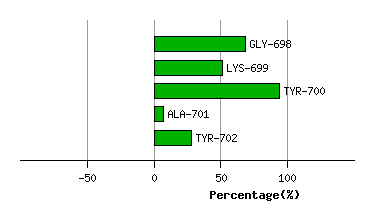
Graph shows rotational transition at bending residues and can be used
to identify hinge bending residues.
Probably only informative for interdomain rotations greater than 20 degrees