Fatty Acid Metabolism Regulator Protein
(All numbering and residues are taken from first PDB file)
![]()
![]()
Bending Residue Dihedral Analysis
Residue
iResidue
i+1Distance of hinge axis to residue i in
(A) Distance of hinge axis to residue i in
(A) Change in
(deg) Change in
(deg) Angle of psi(i) axis to hinge axis
(deg) Angle of psi(i) axis to hinge axis
(deg) Percentage Progress
SER-103
VAL-104
2.0
2.3
-6.7
2.4
143.8
146.7
-43.2
VAL-104
ARG-105
1.8
0.8
1.2
-0.1
70.0
73.2
-6.7
ARG-105
THR-106
5.1
4.2
4.0
-3.4
56.4
58.7
3.5
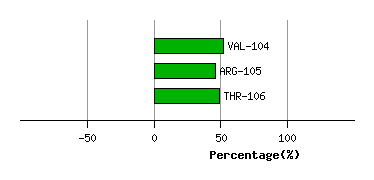
Graph shows rotational transition at bending residues and can be used
to identify hinge bending residues.
Probably only informative for interdomain rotations greater than 20 degrees
Residue
iResidue
i+1Distance of hinge axis to residue i in
(A) Distance of hinge axis to residue i in
(A) Change in
(deg) Change in
(deg) Angle of psi(i) axis to hinge axis
(deg) Angle of psi(i) axis to hinge axis
(deg) Percentage Progress
HIS-217
GLU-218
10.8
11.3
-6.6
6.8
138.5
139.3
3.3
GLU-218
SER-219
13.4
13.7
-0.2
0.7
128.9
127.0
-0.5
SER-219
GLY-220
11.6
11.6
5.2
-0.4
57.4
56.2
45.1
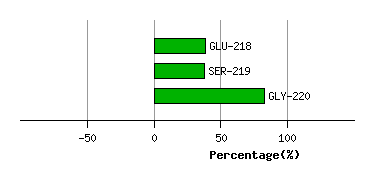
Graph shows rotational transition at bending residues and can be used
to identify hinge bending residues.
Probably only informative for interdomain rotations greater than 20 degrees