Hypothetical Transcriptional Regulator In Qaca 5'Region
(All numbering and residues are taken from first PDB file)
![]()
![]()
Bending Residue Dihedral Analysis
Residue
iResidue
i+1Distance of hinge axis to residue i in
(A) Distance of hinge axis to residue i in
(A) Change in
(deg) Change in
(deg) Angle of psi(i) axis to hinge axis
(deg) Angle of psi(i) axis to hinge axis
(deg) Percentage Progress
GLN-64
TRP-65
6.4
5.6
-6.0
5.1
124.0
123.9
-5.9
TRP-65
LYS-66
2.8
1.9
17.0
-17.7
42.1
37.7
-0.9
LYS-66
LYS-67
3.6
4.1
4.9
-2.1
33.5
36.9
10.7
LYS-67
GLU-68
5.5
5.2
20.7
-18.1
64.0
69.4
7.5
GLU-68
GLN-69
4.9
3.5
-8.5
7.8
115.8
118.7
-3.8
GLN-69
ILE-70
1.8
0.8
-36.9
47.2
159.4
167.9
28.1
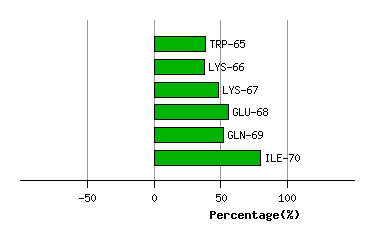
Graph shows rotational transition at bending residues and can be used
to identify hinge bending residues.
Probably only informative for interdomain rotations greater than 20 degrees
Residue
iResidue
i+1Distance of hinge axis to residue i in
(A) Distance of hinge axis to residue i in
(A) Change in
(deg) Change in
(deg) Angle of psi(i) axis to hinge axis
(deg) Angle of psi(i) axis to hinge axis
(deg) Percentage Progress
LEU-87
THR-88
12.1
11.7
-69.9
52.9
70.1
84.8
-17.8
THR-88
THR-89
13.0
12.6
-5.2
-10.1
110.2
120.7
-54.1
THR-89
GLU-90
10.5
10.5
169.2
43.5
24.7
12.9
-371.8
GLU-90
TYR-91
11.8
10.9
-34.4
48.6
120.9
101.7
16.2
TYR-91
TYR-92
8.4
14.6
-168.6
170.4
116.1
106.8
37.3
TYR-92
TYR-93
6.1
14.4
86.7
-27.2
77.4
71.5
118.7
TYR-93
PRO-94
7.8
11.2
163.2
7.9
54.8
26.0
411.7
PRO-94
LEU-95
10.9
12.8
-54.9
59.7
170.6
147.0
10.5
LEU-95
GLN-96
9.3
9.9
-48.9
23.4
111.8
104.2
-44.0
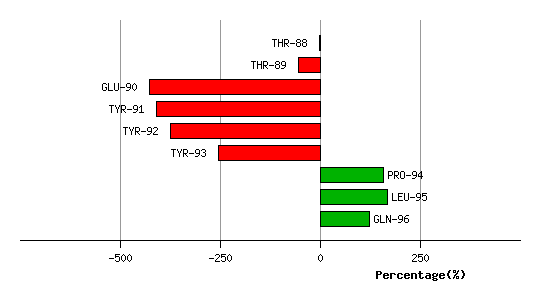
Graph shows rotational transition at bending residues and can be used
to identify hinge bending residues.
Probably only informative for interdomain rotations greater than 20 degrees
Residue
iResidue
i+1Distance of hinge axis to residue i in
(A) Distance of hinge axis to residue i in
(A) Change in
(deg) Change in
(deg) Angle of psi(i) axis to hinge axis
(deg) Angle of psi(i) axis to hinge axis
(deg) Percentage Progress
ASN-117
LYS-118
6.6
7.9
14.3
-17.9
29.3
39.7
-6.5
LYS-118
LEU-119
7.3
8.8
17.0
-10.5
53.2
49.9
15.8
LEU-119
GLU-120
3.7
5.4
-1.6
3.6
118.2
130.4
7.6
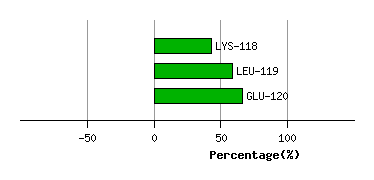
Graph shows rotational transition at bending residues and can be used
to identify hinge bending residues.
Probably only informative for interdomain rotations greater than 20 degrees