425Aa Long Hypothetical Proton Glutamate Symport Protein
(All numbering and residues are taken from first PDB file)
![]()
![]()
Bending Residue Dihedral Analysis
Residue
iResidue
i+1Distance of hinge axis to residue i in
(A) Distance of hinge axis to residue i in
(A) Change in
(deg) Change in
(deg) Angle of psi(i) axis to hinge axis
(deg) Angle of psi(i) axis to hinge axis
(deg) Percentage Progress
GLY-69
ALA-70
26.6
25.1
-12.0
26.6
141.8
141.4
42.1
ALA-70
ALA-71
26.3
25.1
-86.9
44.3
149.3
151.9
-107.0
ALA-71
SER-72
26.7
26.5
-107.2
84.1
87.4
99.1
-39.3
SER-72
ILE-73
22.9
23.8
-109.8
-123.0
119.7
97.9
179.8
ILE-73
SER-74
20.4
21.1
-87.0
-22.1
70.9
131.4
-73.2
SER-74
PRO-75
21.9
23.0
169.9
-6.1
103.1
38.3
-68.0
PRO-75
ALA-76
19.3
20.5
177.0
-48.7
112.9
42.7
-17.6
ALA-76
ARG-77
15.8
20.7
172.5
-84.9
150.9
92.0
-85.1
ARG-77
LEU-78
17.0
22.4
101.6
-96.7
131.3
108.6
3.9
LEU-78
GLY-79
19.2
19.7
-176.2
9.7
85.5
130.2
169.2
GLY-79
ARG-80
17.9
17.7
-138.8
-10.6
65.4
70.5
153.3
ARG-80
VAL-81
14.2
14.0
42.5
-23.4
154.0
123.1
-58.6
VAL-81
GLY-82
15.1
14.1
28.1
-36.4
132.1
159.4
16.5
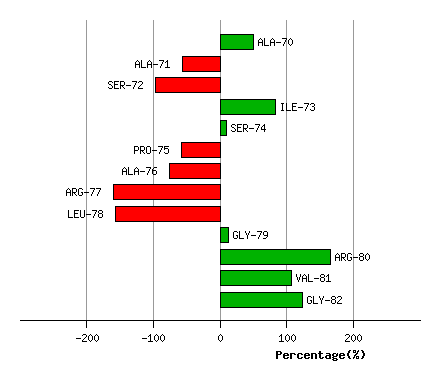
Graph shows rotational transition at bending residues and can be used
to identify hinge bending residues.
Probably only informative for interdomain rotations greater than 20 degrees
Residue
iResidue
i+1Distance of hinge axis to residue i in
(A) Distance of hinge axis to residue i in
(A) Change in
(deg) Change in
(deg) Angle of psi(i) axis to hinge axis
(deg) Angle of psi(i) axis to hinge axis
(deg) Percentage Progress
GLN-123
PRO-124
32.4
30.5
9.5
-10.4
139.2
149.6
-2.8
PRO-124
HIS-125
31.8
30.9
9.7
-23.4
139.1
108.5
20.0
HIS-125
GLN-126
34.1
34.1
-0.3
5.3
46.8
47.1
-4.6
GLN-126
ALA-127
32.9
34.3
-10.4
-14.0
35.3
21.5
58.7
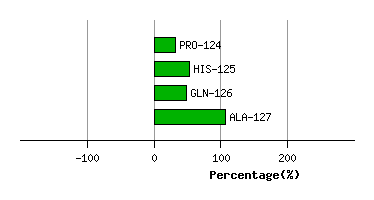
Graph shows rotational transition at bending residues and can be used
to identify hinge bending residues.
Probably only informative for interdomain rotations greater than 20 degrees
Residue
iResidue
i+1Distance of hinge axis to residue i in
(A) Distance of hinge axis to residue i in
(A) Change in
(deg) Change in
(deg) Angle of psi(i) axis to hinge axis
(deg) Angle of psi(i) axis to hinge axis
(deg) Percentage Progress
GLN-220
GLY-221
20.7
20.0
5.6
132.6
101.6
119.4
301.1
GLY-221
VAL-222
18.4
18.3
-82.1
-33.4
24.6
124.1
-373.2
VAL-222
HIS-223
18.2
15.5
-43.2
91.9
81.9
133.1
1.3
HIS-223
VAL-224
17.4
13.8
-31.8
17.6
123.8
163.2
-27.1
VAL-224
VAL-225
14.3
15.7
-31.3
19.3
61.4
113.4
-7.2
VAL-225
GLY-226
11.9
14.1
146.5
-146.2
89.4
64.2
30.6
GLY-226
GLU-227
11.1
10.7
105.1
-3.3
35.5
25.2
230.3
GLU-227
LEU-228
11.4
12.4
-18.7
11.6
149.6
133.9
-10.4
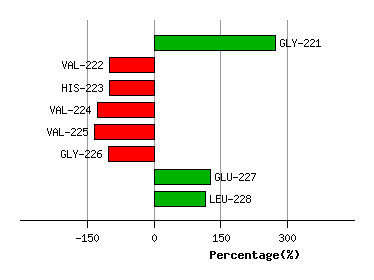
Graph shows rotational transition at bending residues and can be used
to identify hinge bending residues.
Probably only informative for interdomain rotations greater than 20 degrees