2-Methylcitrate Synthase, Mitochondrial
(All numbering and residues are taken from first PDB file)
![]()
![]()
Bending Residue Dihedral Analysis
Residue
iResidue
i+1Distance of hinge axis to residue i in
(A) Distance of hinge axis to residue i in
(A) Change in
(deg) Change in
(deg) Angle of psi(i) axis to hinge axis
(deg) Angle of psi(i) axis to hinge axis
(deg) Percentage Progress
TRP-81
GLU-82
12.8
12.6
-3.0
5.2
82.4
82.2
59.6
GLU-82
GLY-83
10.8
10.6
-1.7
-2.7
31.4
29.5
3.1
GLY-83
SER-84
9.5
9.4
3.3
-7.2
135.3
136.2
61.5
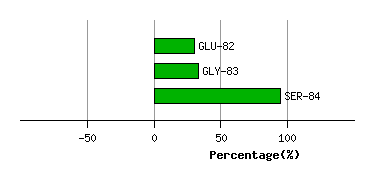
Graph shows rotational transition at bending residues and can be used
to identify hinge bending residues.
Probably only informative for interdomain rotations greater than 20 degrees
Residue
iResidue
i+1Distance of hinge axis to residue i in
(A) Distance of hinge axis to residue i in
(A) Change in
(deg) Change in
(deg) Angle of psi(i) axis to hinge axis
(deg) Angle of psi(i) axis to hinge axis
(deg) Percentage Progress
ARG-93
PHE-94
14.9
15.1
-3.5
1.4
49.6
55.0
55.9
PHE-94
HIS-95
11.7
11.8
-1.0
4.6
54.5
54.4
-18.5
HIS-95
GLY-96
12.7
12.8
0.8
-2.5
71.1
70.5
-5.7
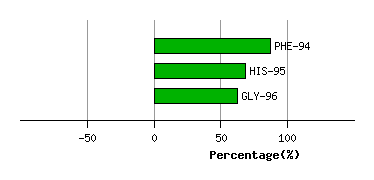
Graph shows rotational transition at bending residues and can be used
to identify hinge bending residues.
Probably only informative for interdomain rotations greater than 20 degrees
Residue
iResidue
i+1Distance of hinge axis to residue i in
(A) Distance of hinge axis to residue i in
(A) Change in
(deg) Change in
(deg) Angle of psi(i) axis to hinge axis
(deg) Angle of psi(i) axis to hinge axis
(deg) Percentage Progress
ALA-301
GLY-302
21.4
21.1
4.4
-1.9
96.0
98.2
44.2
GLY-302
PRO-303
23.9
23.6
7.3
1.1
140.1
142.7
-65.2
PRO-303
LEU-304
25.0
24.7
-1.5
-4.7
101.6
100.6
29.7
LEU-304
HIS-305
25.0
24.7
-4.1
5.0
105.2
108.9
-71.2
HIS-305
GLY-306
21.2
21.0
-66.6
47.6
49.2
43.6
292.5
GLY-306
LEU-307
19.1
18.3
-37.0
30.1
12.3
25.4
135.5
LEU-307
ALA-308
20.8
20.5
-10.1
5.8
58.0
50.7
-25.5
ALA-308
ALA-309
20.2
20.9
5.8
-4.2
144.8
142.0
-87.8
ALA-309
GLN-310
17.3
17.7
3.5
2.5
139.4
137.0
-28.4
GLN-310
GLU-311
19.4
19.2
3.6
-15.9
113.0
119.4
123.4
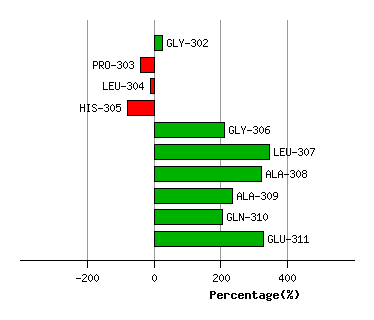
Graph shows rotational transition at bending residues and can be used
to identify hinge bending residues.
Probably only informative for interdomain rotations greater than 20 degrees
Residue
iResidue
i+1Distance of hinge axis to residue i in
(A) Distance of hinge axis to residue i in
(A) Change in
(deg) Change in
(deg) Angle of psi(i) axis to hinge axis
(deg) Angle of psi(i) axis to hinge axis
(deg) Percentage Progress
PRO-359
ARG-360
16.9
17.1
-5.3
1.9
105.3
107.6
-15.2
ARG-360
PHE-361
13.7
14.0
-4.1
0.4
163.8
161.3
-110.2
PHE-361
GLN-362
15.3
15.6
4.9
-7.7
59.7
54.1
49.4
GLN-362
ALA-363
15.9
16.2
4.3
0.5
84.6
83.5
-27.4
ALA-363
LEU-364
12.5
12.8
0.1
-2.0
42.5
46.0
-23.4
LEU-364
MET-365
11.0
11.2
-3.2
4.9
155.0
157.3
86.5
MET-365
ASP-366
13.4
13.5
-0.7
-6.7
101.4
107.8
-87.3
ASP-366
PHE-367
13.2
13.1
8.4
2.7
70.6
77.3
62.6
PHE-367
ALA-368
9.4
9.3
0.0
-5.3
163.8
164.7
-111.3
PHE-367
ALA-368
9.4
9.3
0.0
-5.3
163.8
164.7
-111.3
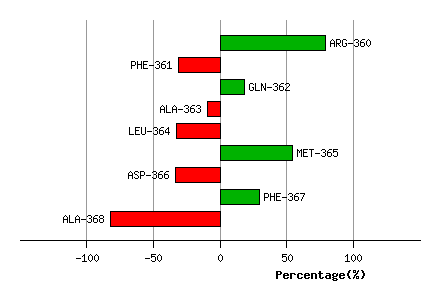
Graph shows rotational transition at bending residues and can be used
to identify hinge bending residues.
Probably only informative for interdomain rotations greater than 20 degrees
Residue
iResidue
i+1Distance of hinge axis to residue i in
(A) Distance of hinge axis to residue i in
(A) Change in
(deg) Change in
(deg) Angle of psi(i) axis to hinge axis
(deg) Angle of psi(i) axis to hinge axis
(deg) Percentage Progress
PHE-367
ALA-368
9.4
9.3
0.0
-5.3
163.8
164.7
-111.3
PHE-367
ALA-368
9.4
9.3
0.0
-5.3
163.8
164.7
-111.3
ALA-368
ALA-369
9.8
9.8
12.7
3.1
51.6
50.7
218.5
ALA-369
THR-370
12.5
12.4
-1.8
-26.9
109.0
117.2
-325.2
THR-370
ARG-371
10.7
10.6
27.9
-7.1
50.4
62.0
354.8
ARG-371
PRO-372
7.6
7.3
-14.4
9.4
148.6
146.1
-43.2
PRO-372
ASP-373
7.9
7.9
-7.6
-3.1
104.8
101.7
21.6
ASP-373
VAL-374
4.9
5.5
8.0
-2.2
114.4
122.5
-68.8
VAL-374
LEU-375
7.3
7.7
-6.6
6.2
114.9
110.5
-16.1
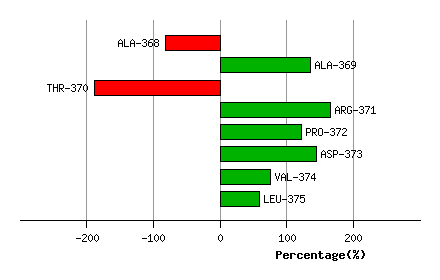
Graph shows rotational transition at bending residues and can be used
to identify hinge bending residues.
Probably only informative for interdomain rotations greater than 20 degrees
Residue
iResidue
i+1Distance of hinge axis to residue i in
(A) Distance of hinge axis to residue i in
(A) Change in
(deg) Change in
(deg) Angle of psi(i) axis to hinge axis
(deg) Angle of psi(i) axis to hinge axis
(deg) Percentage Progress
GLY-412
VAL-413
13.7
13.8
3.4
-0.3
21.7
18.3
22.4
VAL-413
LEU-414
12.9
13.1
2.5
1.7
84.7
83.6
55.7
LEU-414
PHE-415
9.3
9.4
-4.2
2.8
84.1
86.3
-12.6
PHE-415
TYR-416
9.3
9.5
-2.9
1.4
147.0
146.4
-1.6
TYR-416
HIS-417
11.5
11.8
0.1
0.2
43.1
42.2
-3.0
HIS-417
TYR-418
8.6
8.9
-0.3
0.3
92.6
91.6
11.2
HIS-417
TYR-418
8.6
8.9
-0.3
0.3
92.6
91.6
11.2
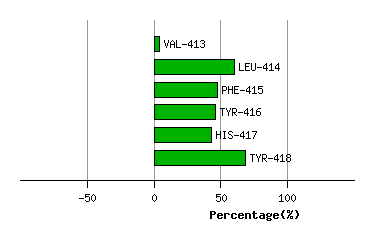
Graph shows rotational transition at bending residues and can be used
to identify hinge bending residues.
Probably only informative for interdomain rotations greater than 20 degrees
Residue
iResidue
i+1Distance of hinge axis to residue i in
(A) Distance of hinge axis to residue i in
(A) Change in
(deg) Change in
(deg) Angle of psi(i) axis to hinge axis
(deg) Angle of psi(i) axis to hinge axis
(deg) Percentage Progress
HIS-417
TYR-418
8.6
8.9
-0.3
0.3
92.6
91.6
11.2
HIS-417
TYR-418
8.6
8.9
-0.3
0.3
92.6
91.6
11.2
TYR-418
GLY-419
6.7
7.0
-3.0
4.8
88.7
89.5
-42.9
GLY-419
PHE-420
10.1
10.5
1.6
-6.1
43.6
45.5
43.2
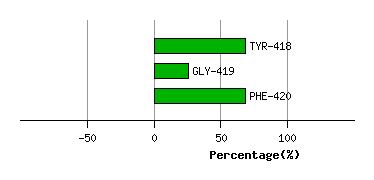
Graph shows rotational transition at bending residues and can be used
to identify hinge bending residues.
Probably only informative for interdomain rotations greater than 20 degrees
Residue
iResidue
i+1Distance of hinge axis to residue i in
(A) Distance of hinge axis to residue i in
(A) Change in
(deg) Change in
(deg) Angle of psi(i) axis to hinge axis
(deg) Angle of psi(i) axis to hinge axis
(deg) Percentage Progress
LEU-424
TYR-425
20.1
20.8
41.5
-17.6
130.5
125.0
-267.0
TYR-425
TYR-426
17.1
17.5
-3.3
4.5
71.5
71.7
62.3
TYR-426
THR-427
14.8
15.2
-5.0
-2.5
10.8
11.4
8.7
THR-427
VAL-428
16.0
15.8
2.5
5.1
117.0
118.5
1.8
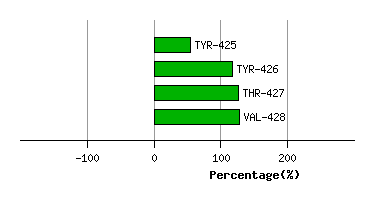
Graph shows rotational transition at bending residues and can be used
to identify hinge bending residues.
Probably only informative for interdomain rotations greater than 20 degrees