Endo-1,4-Beta-Xylanase A
(All numbering and residues are taken from first PDB file)
![]()
![]()
Bending Residue Dihedral Analysis
Residue
iResidue
i+1Distance of hinge axis to residue i in
(A) Distance of hinge axis to residue i in
(A) Change in
(deg) Change in
(deg) Angle of psi(i) axis to hinge axis
(deg) Angle of psi(i) axis to hinge axis
(deg) Percentage Progress
TYR-69
GLY-70
10.9
10.9
-0.4
2.5
55.1
56.6
68.9
GLY-70
TRP-71
8.2
8.1
5.5
-4.6
132.2
131.6
-78.4
TRP-71
THR-72
6.0
6.0
0.1
0.8
91.3
93.0
7.0
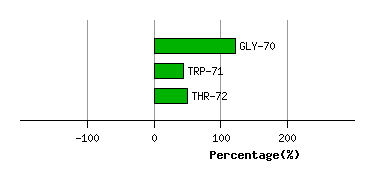
Graph shows rotational transition at bending residues and can be used
to identify hinge bending residues.
Probably only informative for interdomain rotations greater than 20 degrees
Residue
iResidue
i+1Distance of hinge axis to residue i in
(A) Distance of hinge axis to residue i in
(A) Change in
(deg) Change in
(deg) Angle of psi(i) axis to hinge axis
(deg) Angle of psi(i) axis to hinge axis
(deg) Percentage Progress
GLU-78
TYR-79
9.0
9.1
-3.8
3.3
18.1
15.8
-5.3
TYR-79
TYR-80
8.9
8.8
-8.6
7.4
54.2
55.5
158.6
TYR-80
VAL-81
10.8
10.9
-0.6
-0.7
20.4
19.9
-33.0
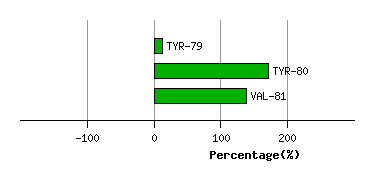
Graph shows rotational transition at bending residues and can be used
to identify hinge bending residues.
Probably only informative for interdomain rotations greater than 20 degrees
Residue
iResidue
i+1Distance of hinge axis to residue i in
(A) Distance of hinge axis to residue i in
(A) Change in
(deg) Change in
(deg) Angle of psi(i) axis to hinge axis
(deg) Angle of psi(i) axis to hinge axis
(deg) Percentage Progress
TYR-108
THR-109
15.9
15.9
3.4
-10.6
148.3
148.9
100.2
THR-109
THR-110
15.3
15.4
-0.8
-4.2
55.6
51.2
-6.0
THR-110
THR-111
16.8
16.8
-7.8
4.2
26.9
27.6
91.0
THR-111
ARG-112
16.3
16.4
5.3
-8.4
121.0
121.6
-54.1
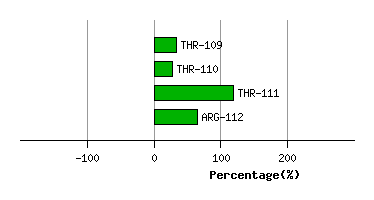
Graph shows rotational transition at bending residues and can be used
to identify hinge bending residues.
Probably only informative for interdomain rotations greater than 20 degrees
Residue
iResidue
i+1Distance of hinge axis to residue i in
(A) Distance of hinge axis to residue i in
(A) Change in
(deg) Change in
(deg) Angle of psi(i) axis to hinge axis
(deg) Angle of psi(i) axis to hinge axis
(deg) Percentage Progress
ASP-122
THR-123
15.2
15.1
-1.1
0.7
79.6
78.9
-128.3
THR-123
THR-124
12.6
12.6
1.0
-8.0
135.4
132.7
405.2
THR-124
PHE-125
13.0
12.9
0.1
-5.7
132.9
133.3
-184.5
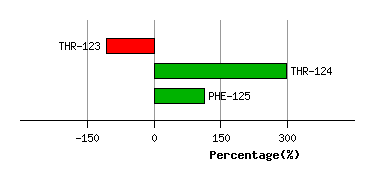
Graph shows rotational transition at bending residues and can be used
to identify hinge bending residues.
Probably only informative for interdomain rotations greater than 20 degrees
Residue
iResidue
i+1Distance of hinge axis to residue i in
(A) Distance of hinge axis to residue i in
(A) Change in
(deg) Change in
(deg) Angle of psi(i) axis to hinge axis
(deg) Angle of psi(i) axis to hinge axis
(deg) Percentage Progress
ASN-159
LEU-160
8.5
8.7
5.6
-5.2
124.3
125.4
-60.0
LEU-160
GLY-161
5.0
5.2
-0.3
3.3
39.6
39.1
-52.0
GLY-161
SER-162
3.7
3.9
-1.6
6.2
104.7
105.5
136.5
SER-162
ASN-163
4.3
4.3
-6.8
4.1
67.4
69.7
-186.0
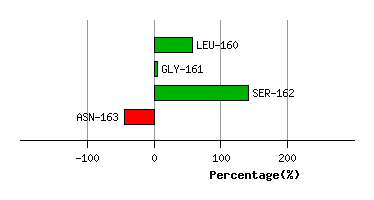
Graph shows rotational transition at bending residues and can be used
to identify hinge bending residues.
Probably only informative for interdomain rotations greater than 20 degrees