Pyruvate Kinase
(All numbering and residues are taken from first PDB file)
![]()
![]()
Bending Residue Dihedral Analysis
Residue
iResidue
i+1Distance of hinge axis to residue i in
(A) Distance of hinge axis to residue i in
(A) Change in
(deg) Change in
(deg) Angle of psi(i) axis to hinge axis
(deg) Angle of psi(i) axis to hinge axis
(deg) Percentage Progress
PRO-87
GLU-88
6.0
5.8
-11.7
50.6
151.5
152.6
165.3
GLU-88
ILE-89
5.7
6.3
-14.1
-2.1
89.0
81.9
5.8
ILE-89
ARG-90
5.7
5.5
-0.4
-8.8
140.5
140.5
-54.7
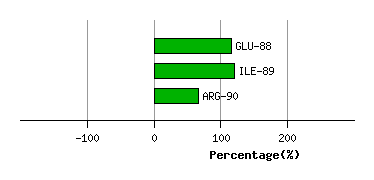
Graph shows rotational transition at bending residues and can be used
to identify hinge bending residues.
Probably only informative for interdomain rotations greater than 20 degrees
Residue
iResidue
i+1Distance of hinge axis to residue i in
(A) Distance of hinge axis to residue i in
(A) Change in
(deg) Change in
(deg) Angle of psi(i) axis to hinge axis
(deg) Angle of psi(i) axis to hinge axis
(deg) Percentage Progress
ASN-130
LEU-131
9.4
9.2
-56.4
12.1
27.7
28.1
182.6
LEU-131
SER-132
9.5
9.2
-6.2
10.6
82.1
80.6
-22.8
SER-132
LYS-133
13.0
13.0
6.3
-2.0
70.5
65.1
30.3
LYS-133
VAL-134
12.5
12.6
-38.8
13.8
110.0
108.3
-9.9
LYS-133
VAL-134
12.5
12.6
-38.8
13.8
110.0
108.3
-9.9
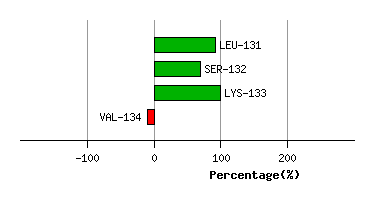
Graph shows rotational transition at bending residues and can be used
to identify hinge bending residues.
Probably only informative for interdomain rotations greater than 20 degrees
Residue
iResidue
i+1Distance of hinge axis to residue i in
(A) Distance of hinge axis to residue i in
(A) Change in
(deg) Change in
(deg) Angle of psi(i) axis to hinge axis
(deg) Angle of psi(i) axis to hinge axis
(deg) Percentage Progress
LYS-133
VAL-134
12.5
12.6
-38.8
13.8
110.0
108.3
-9.9
LYS-133
VAL-134
12.5
12.6
-38.8
13.8
110.0
108.3
-9.9
VAL-134
VAL-135
10.0
10.5
10.9
14.0
24.1
20.9
125.0
VAL-135
ARG-136
11.6
11.3
-25.1
10.5
94.6
98.5
-6.3
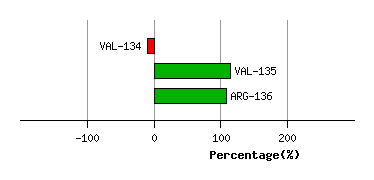
Graph shows rotational transition at bending residues and can be used
to identify hinge bending residues.
Probably only informative for interdomain rotations greater than 20 degrees
Residue
iResidue
i+1Distance of hinge axis to residue i in
(A) Distance of hinge axis to residue i in
(A) Change in
(deg) Change in
(deg) Angle of psi(i) axis to hinge axis
(deg) Angle of psi(i) axis to hinge axis
(deg) Percentage Progress
ARG-175
GLY-176
10.1
10.2
26.0
-5.4
53.0
61.0
40.0
GLY-176
VAL-177
7.0
6.8
-4.5
7.6
80.0
77.5
4.5
VAL-177
ASN-178
4.4
4.6
3.4
-3.1
65.4
67.7
5.4
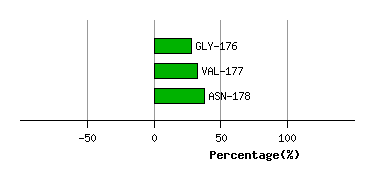
Graph shows rotational transition at bending residues and can be used
to identify hinge bending residues.
Probably only informative for interdomain rotations greater than 20 degrees
Residue
iResidue
i+1Distance of hinge axis to residue i in
(A) Distance of hinge axis to residue i in
(A) Change in
(deg) Change in
(deg) Angle of psi(i) axis to hinge axis
(deg) Angle of psi(i) axis to hinge axis
(deg) Percentage Progress
CYS-182
ASP-183
7.4
8.4
146.3
-144.1
168.5
126.6
-28.2
ASP-183
VAL-184
6.4
7.2
66.0
-29.6
111.3
115.6
-75.9
VAL-184
ASP-185
3.0
3.7
30.7
-56.1
154.9
160.4
129.4
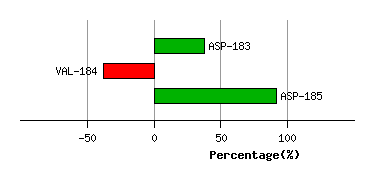
Graph shows rotational transition at bending residues and can be used
to identify hinge bending residues.
Probably only informative for interdomain rotations greater than 20 degrees
Residue
iResidue
i+1Distance of hinge axis to residue i in
(A) Distance of hinge axis to residue i in
(A) Change in
(deg) Change in
(deg) Angle of psi(i) axis to hinge axis
(deg) Angle of psi(i) axis to hinge axis
(deg) Percentage Progress
LEU-186
PRO-187
1.8
1.5
9.2
-1.2
59.3
72.9
28.6
PRO-187
ALA-188
4.5
4.5
-4.7
-10.9
62.5
45.8
31.8
ALA-188
VAL-189
7.9
7.6
34.6
-3.4
102.0
81.0
46.2
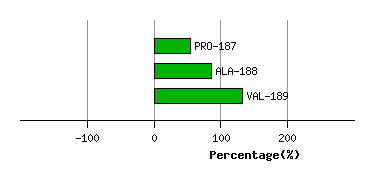
Graph shows rotational transition at bending residues and can be used
to identify hinge bending residues.
Probably only informative for interdomain rotations greater than 20 degrees