Thermolysin (E.C.3.4.24.27)
(All numbering and residues are taken from first PDB file)
![]()
![]()
Bending Residue Dihedral Analysis
Residue
iResidue
i+1Distance of hinge axis to residue i in
(A) Distance of hinge axis to residue i in
(A) Change in
(deg) Change in
(deg) Angle of psi(i) axis to hinge axis
(deg) Angle of psi(i) axis to hinge axis
(deg) Percentage Progress
ASN-33
THR-34
12.7
12.9
4.1
-16.2
53.5
52.8
-221.1
THR-34
ARG-35
10.7
10.8
11.1
-23.5
82.7
80.1
211.4
ARG-35
GLY-36
7.5
7.4
30.2
-1.9
63.3
75.0
198.1
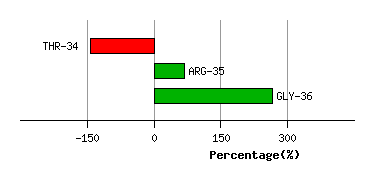
Graph shows rotational transition at bending residues and can be used
to identify hinge bending residues.
Probably only informative for interdomain rotations greater than 20 degrees
Residue
iResidue
i+1Distance of hinge axis to residue i in
(A) Distance of hinge axis to residue i in
(A) Change in
(deg) Change in
(deg) Angle of psi(i) axis to hinge axis
(deg) Angle of psi(i) axis to hinge axis
(deg) Percentage Progress
GLY-38
ILE-39
10.4
10.6
0.9
13.4
31.0
33.4
147.0
ILE-39
PHE-40
9.6
9.4
-6.6
10.9
130.0
127.2
-154.4
PHE-40
THR-41
12.1
12.1
-0.2
2.1
154.4
160.1
132.4
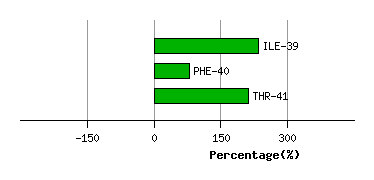
Graph shows rotational transition at bending residues and can be used
to identify hinge bending residues.
Probably only informative for interdomain rotations greater than 20 degrees
Residue
iResidue
i+1Distance of hinge axis to residue i in
(A) Distance of hinge axis to residue i in
(A) Change in
(deg) Change in
(deg) Angle of psi(i) axis to hinge axis
(deg) Angle of psi(i) axis to hinge axis
(deg) Percentage Progress
TYR-75
TYR-76
6.9
7.2
0.4
-8.0
74.7
76.1
-115.8
TYR-76
ALA-77
3.5
3.7
15.2
-13.5
40.5
46.2
-45.8
ALA-77
GLY-78
3.1
3.1
5.8
8.5
30.6
30.4
268.3
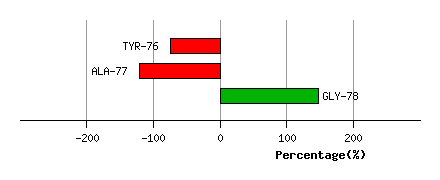
Graph shows rotational transition at bending residues and can be used
to identify hinge bending residues.
Probably only informative for interdomain rotations greater than 20 degrees
Residue
iResidue
i+1Distance of hinge axis to residue i in
(A) Distance of hinge axis to residue i in
(A) Change in
(deg) Change in
(deg) Angle of psi(i) axis to hinge axis
(deg) Angle of psi(i) axis to hinge axis
(deg) Percentage Progress
ASN-96
ASN-97
7.9
8.1
-2.6
2.2
115.1
118.2
-125.1
ASN-97
ALA-98
6.6
7.0
11.8
-9.7
55.9
52.5
112.7
ALA-98
ALA-99
9.6
9.8
-19.7
31.9
133.3
137.7
379.6
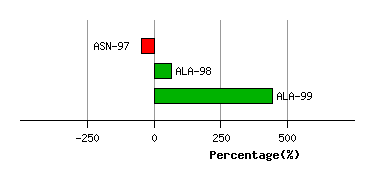
Graph shows rotational transition at bending residues and can be used
to identify hinge bending residues.
Probably only informative for interdomain rotations greater than 20 degrees
Residue
iResidue
i+1Distance of hinge axis to residue i in
(A) Distance of hinge axis to residue i in
(A) Change in
(deg) Change in
(deg) Angle of psi(i) axis to hinge axis
(deg) Angle of psi(i) axis to hinge axis
(deg) Percentage Progress
TRP-115
ASN-116
11.0
11.4
-2.6
2.3
87.4
86.0
235.3
ASN-116
GLY-117
14.6
15.0
-4.3
-0.3
148.2
149.8
-142.7
GLY-117
SER-118
15.2
15.7
19.1
-18.7
55.1
56.7
16.9
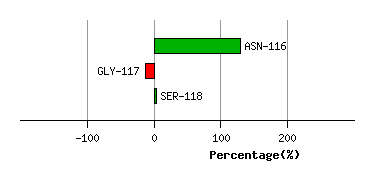
Graph shows rotational transition at bending residues and can be used
to identify hinge bending residues.
Probably only informative for interdomain rotations greater than 20 degrees
Residue
iResidue
i+1Distance of hinge axis to residue i in
(A) Distance of hinge axis to residue i in
(A) Change in
(deg) Change in
(deg) Angle of psi(i) axis to hinge axis
(deg) Angle of psi(i) axis to hinge axis
(deg) Percentage Progress
GLY-123
ASP-124
8.5
8.3
-9.0
14.1
107.8
111.0
10.5
ASP-124
GLY-125
6.7
6.7
0.6
-7.8
48.2
49.0
-75.8
GLY-125
ASP-126
5.2
5.3
-4.1
7.4
153.7
155.5
51.4
ASP-126
GLY-127
5.6
5.7
19.0
-17.6
64.1
63.3
130.2
GLY-127
GLN-128
2.5
2.6
-14.3
10.0
55.8
59.7
34.5
GLY-127
GLN-128
2.5
2.6
-14.3
10.0
55.8
59.7
34.5
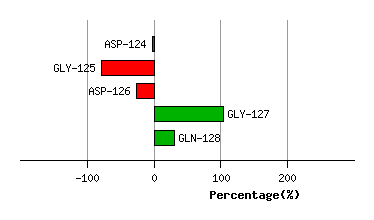
Graph shows rotational transition at bending residues and can be used
to identify hinge bending residues.
Probably only informative for interdomain rotations greater than 20 degrees
Residue
iResidue
i+1Distance of hinge axis to residue i in
(A) Distance of hinge axis to residue i in
(A) Change in
(deg) Change in
(deg) Angle of psi(i) axis to hinge axis
(deg) Angle of psi(i) axis to hinge axis
(deg) Percentage Progress
GLY-127
GLN-128
2.5
2.6
-14.3
10.0
55.8
59.7
34.5
GLY-127
GLN-128
2.5
2.6
-14.3
10.0
55.8
59.7
34.5
GLN-128
THR-129
2.0
2.0
-2.9
0.1
125.5
127.8
-118.4
THR-129
PHE-130
4.7
4.8
-2.6
6.4
151.8
152.2
109.2
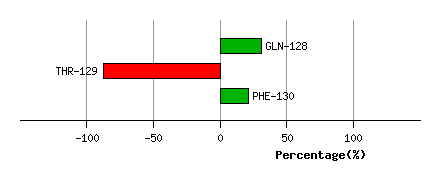
Graph shows rotational transition at bending residues and can be used
to identify hinge bending residues.
Probably only informative for interdomain rotations greater than 20 degrees
Residue
iResidue
i+1Distance of hinge axis to residue i in
(A) Distance of hinge axis to residue i in
(A) Change in
(deg) Change in
(deg) Angle of psi(i) axis to hinge axis
(deg) Angle of psi(i) axis to hinge axis
(deg) Percentage Progress
PRO-132
LEU-133
3.8
3.7
-4.5
5.9
46.6
45.9
18.2
LEU-133
SER-134
2.5
2.3
-1.0
-2.5
30.0
27.0
75.8
SER-134
GLY-135
2.5
2.5
4.8
-13.7
86.1
87.1
48.9
GLY-135
GLY-136
2.8
3.1
21.0
-11.3
114.3
107.5
-53.8
GLY-136
ILE-137
2.8
3.1
8.3
-11.4
169.6
170.7
-6.5
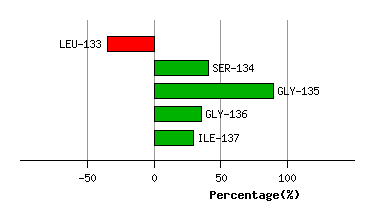
Graph shows rotational transition at bending residues and can be used
to identify hinge bending residues.
Probably only informative for interdomain rotations greater than 20 degrees
Residue
iResidue
i+1Distance of hinge axis to residue i in
(A) Distance of hinge axis to residue i in
(A) Change in
(deg) Change in
(deg) Angle of psi(i) axis to hinge axis
(deg) Angle of psi(i) axis to hinge axis
(deg) Percentage Progress
PHE-178
TYR-179
12.3
12.4
2.3
-6.0
133.3
137.9
91.8
TYR-179
ALA-180
10.4
10.8
8.3
-18.1
68.4
71.2
28.3
ALA-180
ASN-181
9.9
10.2
17.0
-15.1
73.4
57.7
40.7
ASN-181
LYS-182
13.3
13.4
6.7
33.1
32.3
27.5
1094.8
LYS-182
ASN-183
12.8
11.8
-44.6
7.6
126.8
135.2
-840.1
ASN-183
PRO-184
13.2
13.9
18.7
-3.0
105.9
101.4
-334.4
PRO-184
ASP-185
12.9
13.7
-19.0
22.9
125.7
121.6
-11.0
ASP-185
TRP-186
14.5
14.9
2.1
-4.3
106.2
107.9
85.0
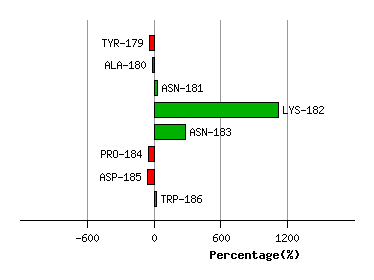
Graph shows rotational transition at bending residues and can be used
to identify hinge bending residues.
Probably only informative for interdomain rotations greater than 20 degrees