Transcriptional Regulator, Tetr Family
(All numbering and residues are taken from first PDB file)
![]()
![]()
Bending Residue Dihedral Analysis
Residue
iResidue
i+1Distance of hinge axis to residue i in
(A) Distance of hinge axis to residue i in
(A) Change in
(deg) Change in
(deg) Angle of psi(i) axis to hinge axis
(deg) Angle of psi(i) axis to hinge axis
(deg) Percentage Progress
GLU-60
LYS-61
8.0
7.2
-3.2
-3.6
35.9
43.3
79.1
LYS-61
LEU-62
8.8
8.5
3.7
3.1
111.7
117.0
-56.6
LEU-62
GLN-63
5.2
5.0
-10.7
8.5
125.9
128.0
40.7
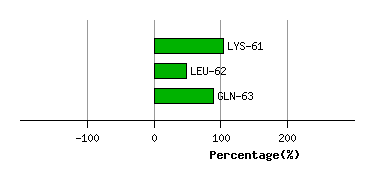
Graph shows rotational transition at bending residues and can be used
to identify hinge bending residues.
Probably only informative for interdomain rotations greater than 20 degrees
Residue
iResidue
i+1Distance of hinge axis to residue i in
(A) Distance of hinge axis to residue i in
(A) Change in
(deg) Change in
(deg) Angle of psi(i) axis to hinge axis
(deg) Angle of psi(i) axis to hinge axis
(deg) Percentage Progress
TRP-85
ILE-86
7.7
7.3
9.3
6.5
65.6
63.9
43.0
ILE-86
GLU-87
6.1
6.1
-9.9
14.8
148.0
144.4
25.2
GLU-87
LYS-88
5.8
5.6
-1.0
-12.9
77.7
74.7
-26.7
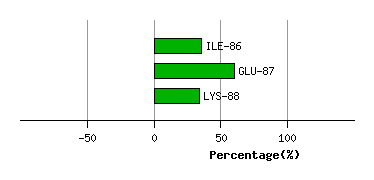
Graph shows rotational transition at bending residues and can be used
to identify hinge bending residues.
Probably only informative for interdomain rotations greater than 20 degrees
Residue
iResidue
i+1Distance of hinge axis to residue i in
(A) Distance of hinge axis to residue i in
(A) Change in
(deg) Change in
(deg) Angle of psi(i) axis to hinge axis
(deg) Angle of psi(i) axis to hinge axis
(deg) Percentage Progress
ASP-120
LEU-121
5.2
6.1
13.2
-33.5
144.7
136.2
111.3
LEU-121
GLU-122
4.3
4.1
37.2
-2.2
76.8
79.3
116.3
GLU-122
LYS-123
4.1
4.3
8.6
-9.1
69.0
82.0
31.0
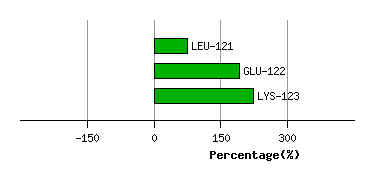
Graph shows rotational transition at bending residues and can be used
to identify hinge bending residues.
Probably only informative for interdomain rotations greater than 20 degrees
Residue
iResidue
i+1Distance of hinge axis to residue i in
(A) Distance of hinge axis to residue i in
(A) Change in
(deg) Change in
(deg) Angle of psi(i) axis to hinge axis
(deg) Angle of psi(i) axis to hinge axis
(deg) Percentage Progress
SER-159
GLY-160
12.7
9.5
9.7
-8.2
33.9
53.4
12.6
GLY-160
PHE-161
14.8
12.3
13.7
-9.8
43.2
21.4
51.2
PHE-161
GLU-162
11.9
10.6
-1.9
-3.1
81.5
92.7
4.8
GLU-162
GLU-163
10.0
7.6
-0.4
-0.5
106.4
88.6
-51.6
GLU-163
VAL-164
13.3
10.5
3.0
4.7
8.8
27.0
99.0
VAL-164
TYR-165
13.2
12.1
-10.5
-19.9
108.5
132.6
-90.6
TYR-165
LEU-166
9.6
9.2
20.6
-2.5
96.2
102.4
-56.0
LEU-166
ARG-167
11.5
9.1
7.0
-11.1
51.8
77.2
28.1
ARG-167
THR-168
14.6
12.9
-13.6
42.3
159.3
170.2
167.1
THR-168
TYR-169
12.6
12.8
0.6
8.1
79.9
57.6
60.5
TYR-169
GLN-170
9.6
10.5
21.3
11.7
120.6
111.3
-95.4
GLN-170
GLY-171
11.2
12.5
-4.0
1.5
122.8
132.3
3.2
GLY-171
LYS-172
12.5
13.6
-3.0
-3.0
167.2
160.1
-51.1
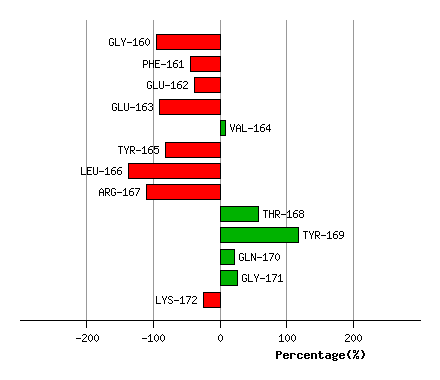
Graph shows rotational transition at bending residues and can be used
to identify hinge bending residues.
Probably only informative for interdomain rotations greater than 20 degrees