Adenylate Kinase
(All numbering and residues are taken from first PDB file)
![]()
![]()
Bending Residue Dihedral Analysis
Residue
iResidue
i+1Distance of hinge axis to residue i in
(A) Distance of hinge axis to residue i in
(A) Change in
(deg) Change in
(deg) Angle of psi(i) axis to hinge axis
(deg) Angle of psi(i) axis to hinge axis
(deg) Percentage Progress
LEU-115
ILE-116
2.7
3.1
-12.9
-7.0
43.5
49.4
42.1
ILE-116
VAL-117
1.8
1.5
11.4
-5.2
108.7
111.4
16.7
VAL-117
ASP-118
2.0
3.2
3.8
2.4
54.7
52.4
1.7
ASP-118
ARG-119
3.4
4.1
-10.3
1.4
97.5
92.4
-14.9
ARG-119
ILE-120
3.8
3.0
35.2
-50.1
139.8
141.6
18.1
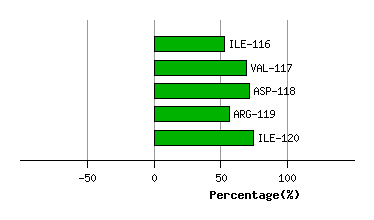
Graph shows rotational transition at bending residues and can be used
to identify hinge bending residues.
Probably only informative for interdomain rotations greater than 20 degrees
Residue
iResidue
i+1Distance of hinge axis to residue i in
(A) Distance of hinge axis to residue i in
(A) Change in
(deg) Change in
(deg) Angle of psi(i) axis to hinge axis
(deg) Angle of psi(i) axis to hinge axis
(deg) Percentage Progress
ARG-156
LYS-157
11.6
11.5
11.4
-4.1
55.2
62.3
4.2
LYS-157
ASP-158
10.6
9.9
-7.0
30.8
88.0
74.4
-19.5
ASP-158
ASP-159
6.9
6.5
-50.1
31.8
25.1
28.8
30.9
ASP-159
GLN-160
6.8
7.0
-97.7
95.5
82.2
89.8
27.7
GLN-160
GLU-161
6.5
8.3
-15.6
-12.1
83.1
77.1
16.5
GLU-161
GLU-162
5.4
7.7
19.2
-11.9
39.8
42.5
6.4
GLU-162
THR-163
5.5
8.4
9.6
-5.4
67.6
62.6
-2.5
THR-163
VAL-164
2.5
5.2
-11.4
6.1
51.6
54.6
3.9
VAL-164
ARG-165
0.6
3.1
-19.2
6.0
94.4
88.9
-1.5
ARG-165
LYS-166
3.8
5.9
23.4
-18.0
39.6
32.5
8.5
LYS-166
ARG-167
3.5
5.8
-6.9
6.4
78.3
94.2
9.4
ARG-167
LEU-168
3.4
3.2
2.9
-6.9
122.3
122.3
6.8
LEU-168
VAL-169
5.7
5.6
3.0
-5.6
61.1
69.4
-14.5
VAL-169
GLU-170
8.1
8.8
9.5
-2.3
60.0
42.8
-3.2
GLU-170
TYR-171
8.4
7.9
-1.0
-10.7
48.9
72.4
9.5
TYR-171
HIS-172
9.6
8.6
6.2
-9.6
98.4
108.7
-3.4
HIS-172
GLN-173
11.9
11.4
-2.8
13.4
138.6
131.6
8.6
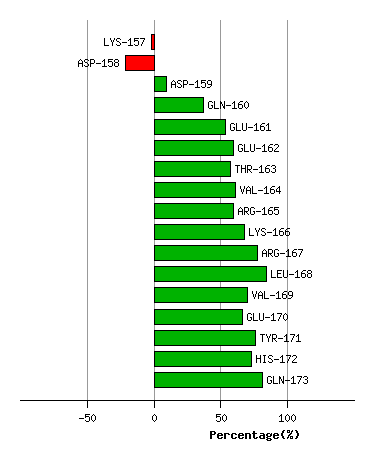
Graph shows rotational transition at bending residues and can be used
to identify hinge bending residues.
Probably only informative for interdomain rotations greater than 20 degrees