Sucrose Isomerase
(All numbering and residues are taken from first PDB file)
![]()
![]()
Bending Residue Dihedral Analysis
Residue
iResidue
i+1Distance of hinge axis to residue i in
(A) Distance of hinge axis to residue i in
(A) Change in
(deg) Change in
(deg) Angle of psi(i) axis to hinge axis
(deg) Angle of psi(i) axis to hinge axis
(deg) Percentage Progress
ILE-283
CYS-284
5.6
5.6
4.7
-14.7
81.2
85.9
-44.8
CYS-284
TYR-285
4.2
3.9
5.3
8.5
42.1
31.3
113.0
TYR-285
ASP-286
2.0
2.1
-3.7
3.5
90.5
90.4
-13.6
ASP-286
ARG-287
1.6
1.5
6.6
-11.9
119.7
119.2
37.4
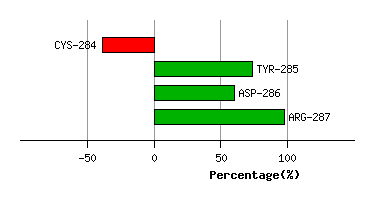
Graph shows rotational transition at bending residues and can be used
to identify hinge bending residues.
Probably only informative for interdomain rotations greater than 20 degrees
Residue
iResidue
i+1Distance of hinge axis to residue i in
(A) Distance of hinge axis to residue i in
(A) Change in
(deg) Change in
(deg) Angle of psi(i) axis to hinge axis
(deg) Angle of psi(i) axis to hinge axis
(deg) Percentage Progress
ARG-291
TRP-292
9.5
9.2
0.0
-0.3
141.1
140.9
10.4
TRP-292
HIS-293
9.2
9.2
22.6
-23.5
105.9
107.1
2.9
HIS-293
THR-294
8.9
8.9
-0.8
-13.2
65.1
66.8
82.4
THR-294
ILE-295
6.3
6.2
-8.6
-0.6
30.5
34.4
106.9
ILE-295
PRO-296
6.6
6.5
-5.1
-0.7
83.9
86.6
-18.8
PRO-296
ARG-297
7.6
7.4
-3.6
7.3
52.1
47.0
-5.4
ARG-297
THR-298
6.0
5.9
8.1
-8.5
84.6
84.2
-20.3
THR-298
LEU-299
8.5
8.6
-2.0
4.2
94.0
89.9
-6.1
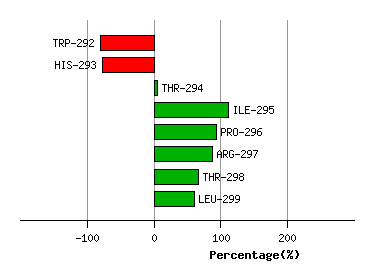
Graph shows rotational transition at bending residues and can be used
to identify hinge bending residues.
Probably only informative for interdomain rotations greater than 20 degrees
Residue
iResidue
i+1Distance of hinge axis to residue i in
(A) Distance of hinge axis to residue i in
(A) Change in
(deg) Change in
(deg) Angle of psi(i) axis to hinge axis
(deg) Angle of psi(i) axis to hinge axis
(deg) Percentage Progress
LEU-323
GLY-324
9.3
9.5
4.4
-7.2
135.8
136.5
66.6
GLY-324
ASN-325
8.2
8.4
5.7
-11.7
103.9
108.4
-79.4
ASN-325
HIS-326
9.4
9.4
-4.3
8.7
50.7
55.7
43.4
HIS-326
ASP-327
9.2
9.2
-7.2
4.7
107.8
115.4
-24.8
ASP-327
ASN-328
8.2
8.3
2.8
-4.0
66.4
65.8
47.4
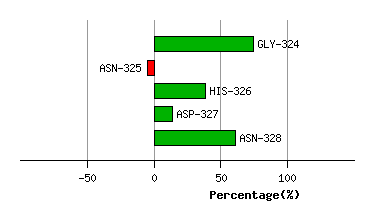
Graph shows rotational transition at bending residues and can be used
to identify hinge bending residues.
Probably only informative for interdomain rotations greater than 20 degrees
Residue
iResidue
i+1Distance of hinge axis to residue i in
(A) Distance of hinge axis to residue i in
(A) Change in
(deg) Change in
(deg) Angle of psi(i) axis to hinge axis
(deg) Angle of psi(i) axis to hinge axis
(deg) Percentage Progress
THR-372
ASN-373
6.5
6.3
7.5
-11.5
97.8
98.2
56.1
ASN-373
TYR-374
3.6
3.4
7.8
-8.6
152.8
154.0
-13.2
TYR-374
PRO-375
3.6
3.4
2.7
-0.8
84.9
83.6
17.1
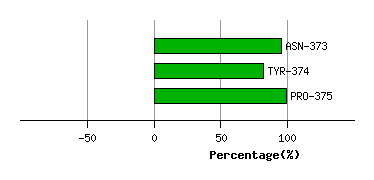
Graph shows rotational transition at bending residues and can be used
to identify hinge bending residues.
Probably only informative for interdomain rotations greater than 20 degrees
Residue
iResidue
i+1Distance of hinge axis to residue i in
(A) Distance of hinge axis to residue i in
(A) Change in
(deg) Change in
(deg) Angle of psi(i) axis to hinge axis
(deg) Angle of psi(i) axis to hinge axis
(deg) Percentage Progress
GLN-380
ASP-381
13.0
12.9
2.8
3.2
76.9
77.4
72.5
ASP-381
PHE-382
9.2
9.1
-2.1
-1.5
55.9
56.2
102.9
PHE-382
ASP-383
9.0
9.1
0.9
-12.5
70.8
69.3
39.1
ASP-383
ASP-384
10.2
10.5
10.9
-16.3
149.1
141.2
82.1
ASP-384
ILE-385
10.5
11.2
19.0
-2.3
103.6
107.8
-171.3
ILE-385
GLU-386
14.2
14.8
-5.0
5.2
28.9
25.0
86.8
GLU-386
VAL-387
13.3
13.5
-0.3
-7.4
86.1
89.3
62.0
GLU-386
VAL-387
13.3
13.5
-0.3
-7.4
86.1
89.3
62.0
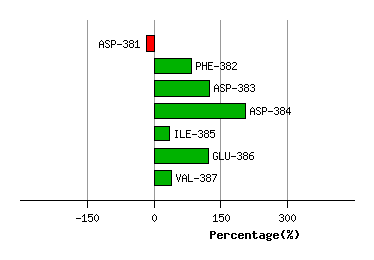
Graph shows rotational transition at bending residues and can be used
to identify hinge bending residues.
Probably only informative for interdomain rotations greater than 20 degrees
Residue
iResidue
i+1Distance of hinge axis to residue i in
(A) Distance of hinge axis to residue i in
(A) Change in
(deg) Change in
(deg) Angle of psi(i) axis to hinge axis
(deg) Angle of psi(i) axis to hinge axis
(deg) Percentage Progress
GLU-386
VAL-387
13.3
13.5
-0.3
-7.4
86.1
89.3
62.0
GLU-386
VAL-387
13.3
13.5
-0.3
-7.4
86.1
89.3
62.0
VAL-387
LYS-388
12.9
12.8
1.5
-1.5
102.2
100.8
21.9
LYS-388
GLY-389
16.4
16.3
0.2
7.9
33.9
29.8
141.6
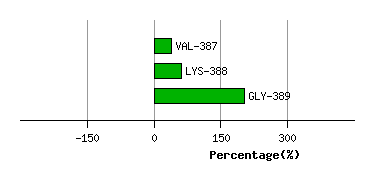
Graph shows rotational transition at bending residues and can be used
to identify hinge bending residues.
Probably only informative for interdomain rotations greater than 20 degrees
Residue
iResidue
i+1Distance of hinge axis to residue i in
(A) Distance of hinge axis to residue i in
(A) Change in
(deg) Change in
(deg) Angle of psi(i) axis to hinge axis
(deg) Angle of psi(i) axis to hinge axis
(deg) Percentage Progress
ALA-410
LEU-411
7.0
7.1
7.4
-14.0
121.6
118.5
72.1
LEU-411
THR-412
5.2
5.1
9.8
-0.6
110.2
116.6
-15.7
THR-412
SER-413
4.0
4.1
-5.8
10.5
127.4
128.2
-12.1
SER-413
ARG-414
5.3
5.4
6.6
-16.9
105.6
105.1
5.5
SER-413
ARG-414
5.3
5.4
6.6
-16.9
105.6
105.1
5.5
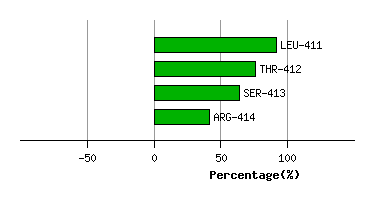
Graph shows rotational transition at bending residues and can be used
to identify hinge bending residues.
Probably only informative for interdomain rotations greater than 20 degrees
Residue
iResidue
i+1Distance of hinge axis to residue i in
(A) Distance of hinge axis to residue i in
(A) Change in
(deg) Change in
(deg) Angle of psi(i) axis to hinge axis
(deg) Angle of psi(i) axis to hinge axis
(deg) Percentage Progress
SER-413
ARG-414
5.3
5.4
6.6
-16.9
105.6
105.1
5.5
SER-413
ARG-414
5.3
5.4
6.6
-16.9
105.6
105.1
5.5
ARG-414
ASP-415
5.7
6.0
0.9
-3.1
162.4
160.9
57.8
ASP-415
ASN-416
4.8
5.1
5.1
-4.0
95.0
95.1
-11.5
ASN-416
ALA-417
1.2
1.4
-1.6
2.1
97.0
100.0
35.5
ASN-416
ALA-417
1.2
1.4
-1.6
2.1
97.0
100.0
35.5
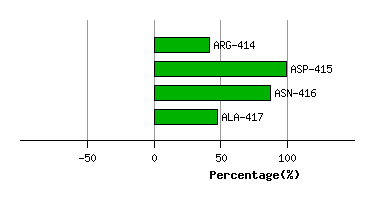
Graph shows rotational transition at bending residues and can be used
to identify hinge bending residues.
Probably only informative for interdomain rotations greater than 20 degrees
Residue
iResidue
i+1Distance of hinge axis to residue i in
(A) Distance of hinge axis to residue i in
(A) Change in
(deg) Change in
(deg) Angle of psi(i) axis to hinge axis
(deg) Angle of psi(i) axis to hinge axis
(deg) Percentage Progress
ASN-416
ALA-417
1.2
1.4
-1.6
2.1
97.0
100.0
35.5
ASN-416
ALA-417
1.2
1.4
-1.6
2.1
97.0
100.0
35.5
ALA-417
ARG-418
4.5
4.5
0.8
4.8
33.7
36.0
4.1
ARG-418
THR-419
5.8
5.9
5.6
-7.8
25.7
24.0
-2.0
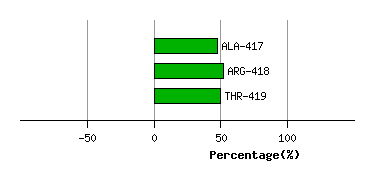
Graph shows rotational transition at bending residues and can be used
to identify hinge bending residues.
Probably only informative for interdomain rotations greater than 20 degrees