Helicase
(All numbering and residues are taken from first PDB file)
![]()
![]()
Bending Residue Dihedral Analysis
Residue
iResidue
i+1Distance of hinge axis to residue i in
(A) Distance of hinge axis to residue i in
(A) Change in
(deg) Change in
(deg) Angle of psi(i) axis to hinge axis
(deg) Angle of psi(i) axis to hinge axis
(deg) Percentage Progress
ALA-323
THR-324
9.6
9.5
-11.6
-2.6
107.8
101.3
3.4
THR-324
PRO-325
6.4
6.2
8.2
-16.2
81.5
71.6
2.5
PRO-325
PRO-326
6.3
6.4
23.8
4.2
54.2
67.1
30.1
PRO-326
GLY-327
5.9
5.7
-23.4
13.2
60.0
50.3
26.1
GLY-327
SER-328
4.8
4.0
-5.5
-5.2
58.1
59.6
17.1
SER-328
VAL-329
1.3
1.1
15.7
-18.7
68.9
68.9
-10.1
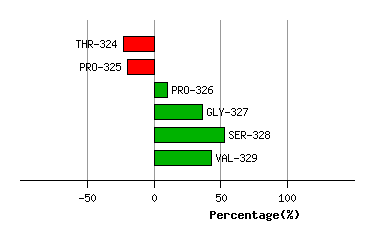
Graph shows rotational transition at bending residues and can be used
to identify hinge bending residues.
Probably only informative for interdomain rotations greater than 20 degrees
Residue
iResidue
i+1Distance of hinge axis to residue i in
(A) Distance of hinge axis to residue i in
(A) Change in
(deg) Change in
(deg) Angle of psi(i) axis to hinge axis
(deg) Angle of psi(i) axis to hinge axis
(deg) Percentage Progress
VAL-432
THR-433
5.0
5.0
-6.5
17.1
101.5
99.6
-5.5
THR-433
GLN-434
1.5
1.7
13.6
-49.9
137.6
143.8
73.6
GLN-434
THR-435
2.1
2.6
19.5
-11.8
75.5
67.7
10.3
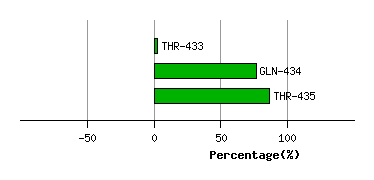
Graph shows rotational transition at bending residues and can be used
to identify hinge bending residues.
Probably only informative for interdomain rotations greater than 20 degrees
Residue
iResidue
i+1Distance of hinge axis to residue i in
(A) Distance of hinge axis to residue i in
(A) Change in
(deg) Change in
(deg) Angle of psi(i) axis to hinge axis
(deg) Angle of psi(i) axis to hinge axis
(deg) Percentage Progress
ILE-446
ASP-447
5.5
5.7
-2.7
40.6
103.4
98.5
10.3
ASP-447
THR-448
1.7
2.7
-36.6
-8.9
30.6
48.9
107.7
THR-448
THR-449
1.2
0.8
-9.3
-1.7
84.5
80.1
-2.8
THR-449
THR-450
3.9
3.8
-1.9
-16.6
29.3
34.6
67.5
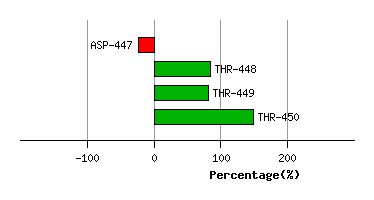
Graph shows rotational transition at bending residues and can be used
to identify hinge bending residues.
Probably only informative for interdomain rotations greater than 20 degrees
Residue
iResidue
i+1Distance of hinge axis to residue i in
(A) Distance of hinge axis to residue i in
(A) Change in
(deg) Change in
(deg) Angle of psi(i) axis to hinge axis
(deg) Angle of psi(i) axis to hinge axis
(deg) Percentage Progress
ARG-481
PRO-482
6.1
5.4
33.4
21.2
53.1
52.9
101.0
PRO-482
SER-483
3.8
3.8
-14.4
-24.1
59.5
68.7
42.3
SER-483
GLY-484
1.5
1.6
0.4
9.8
95.1
89.4
10.5
GLY-484
MET-485
5.1
5.2
-28.6
2.8
50.2
42.8
47.2
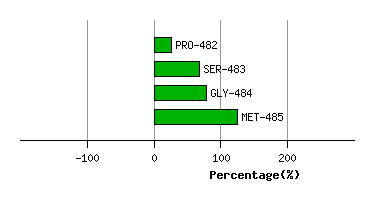
Graph shows rotational transition at bending residues and can be used
to identify hinge bending residues.
Probably only informative for interdomain rotations greater than 20 degrees