Glutamate Receptor, Ionotropic Kainate 1
(All numbering and residues are taken from first PDB file)
![]()
![]()
Bending Residue Dihedral Analysis
Residue
iResidue
i+1Distance of hinge axis to residue i in
(A) Distance of hinge axis to residue i in
(A) Change in
(deg) Change in
(deg) Angle of psi(i) axis to hinge axis
(deg) Angle of psi(i) axis to hinge axis
(deg) Percentage Progress
GLY-109
ILE-110
8.3
8.3
-55.1
42.6
77.7
75.3
100.1
ILE-110
SER-111
5.6
5.4
-3.6
-4.9
39.5
44.8
84.9
SER-111
ILE-112
6.0
6.0
12.6
-11.7
100.9
103.6
11.6
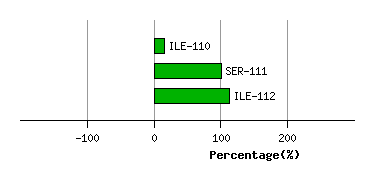
Graph shows rotational transition at bending residues and can be used
to identify hinge bending residues.
Probably only informative for interdomain rotations greater than 20 degrees
Residue
iResidue
i+1Distance of hinge axis to residue i in
(A) Distance of hinge axis to residue i in
(A) Change in
(deg) Change in
(deg) Angle of psi(i) axis to hinge axis
(deg) Angle of psi(i) axis to hinge axis
(deg) Percentage Progress
GLU-190
SER-191
3.4
3.6
18.4
-1.9
17.4
16.3
201.9
SER-191
THR-192
5.2
5.5
-5.7
9.0
132.0
125.0
42.2
THR-192
SER-193
6.7
6.9
-3.3
-3.1
112.6
112.9
-91.4
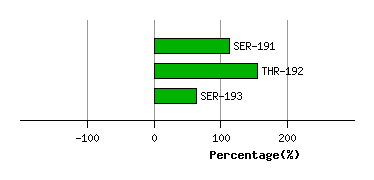
Graph shows rotational transition at bending residues and can be used
to identify hinge bending residues.
Probably only informative for interdomain rotations greater than 20 degrees
Residue
iResidue
i+1Distance of hinge axis to residue i in
(A) Distance of hinge axis to residue i in
(A) Change in
(deg) Change in
(deg) Angle of psi(i) axis to hinge axis
(deg) Angle of psi(i) axis to hinge axis
(deg) Percentage Progress
ILE-194
GLU-195
1.6
1.8
-3.0
7.0
25.4
26.9
-52.9
GLU-195
TYR-196
4.3
4.6
-7.6
4.7
58.0
61.8
35.3
TYR-196
VAL-197
5.4
5.5
0.4
-3.8
115.4
114.9
44.3
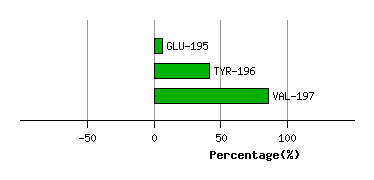
Graph shows rotational transition at bending residues and can be used
to identify hinge bending residues.
Probably only informative for interdomain rotations greater than 20 degrees
Residue
iResidue
i+1Distance of hinge axis to residue i in
(A) Distance of hinge axis to residue i in
(A) Change in
(deg) Change in
(deg) Angle of psi(i) axis to hinge axis
(deg) Angle of psi(i) axis to hinge axis
(deg) Percentage Progress
THR-205
GLN-206
5.4
5.3
4.2
13.3
162.5
163.2
-238.4
GLN-206
ILE-207
5.8
6.1
24.5
-9.7
97.4
97.1
74.3
ILE-207
GLY-208
9.2
9.4
-11.6
-18.7
38.7
46.1
331.7
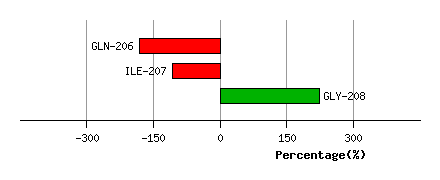
Graph shows rotational transition at bending residues and can be used
to identify hinge bending residues.
Probably only informative for interdomain rotations greater than 20 degrees