Mitogen-Activated Protein Kinase 8
(All numbering and residues are taken from first PDB file)
![]()
![]()
Bending Residue Dihedral Analysis
Residue
iResidue
i+1Distance of hinge axis to residue i in
(A) Distance of hinge axis to residue i in
(A) Change in
(deg) Change in
(deg) Angle of psi(i) axis to hinge axis
(deg) Angle of psi(i) axis to hinge axis
(deg) Percentage Progress
CYS-79
VAL-80
5.1
5.3
-42.2
47.0
89.6
74.7
-54.8
VAL-80
ASN-81
1.4
1.6
-5.3
-20.1
27.9
29.6
158.7
ASN-81
HIS-82
2.8
2.6
23.3
-18.2
86.5
92.5
14.6
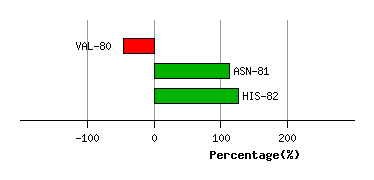
Graph shows rotational transition at bending residues and can be used
to identify hinge bending residues.
Probably only informative for interdomain rotations greater than 20 degrees
Residue
iResidue
i+1Distance of hinge axis to residue i in
(A) Distance of hinge axis to residue i in
(A) Change in
(deg) Change in
(deg) Angle of psi(i) axis to hinge axis
(deg) Angle of psi(i) axis to hinge axis
(deg) Percentage Progress
ILE-85
ILE-86
5.1
5.1
4.6
12.0
40.4
44.9
88.6
ILE-86
GLY-87
4.7
4.4
-14.3
7.7
77.5
81.7
24.1
GLY-87
LEU-88
2.7
1.4
-30.8
23.9
116.9
109.3
-13.2
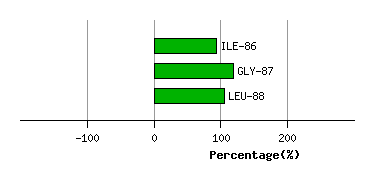
Graph shows rotational transition at bending residues and can be used
to identify hinge bending residues.
Probably only informative for interdomain rotations greater than 20 degrees
Residue
iResidue
i+1Distance of hinge axis to residue i in
(A) Distance of hinge axis to residue i in
(A) Change in
(deg) Change in
(deg) Angle of psi(i) axis to hinge axis
(deg) Angle of psi(i) axis to hinge axis
(deg) Percentage Progress
GLU-109
LEU-110
3.8
3.7
8.1
-32.2
101.2
109.4
118.5
LEU-110
MET-111
6.6
6.3
-2.7
-2.9
95.4
80.5
35.6
MET-111
ASP-112
8.8
8.3
-4.5
12.1
47.7
47.2
-5.8
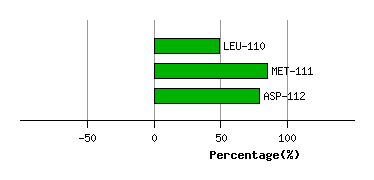
Graph shows rotational transition at bending residues and can be used
to identify hinge bending residues.
Probably only informative for interdomain rotations greater than 20 degrees
Residue
iResidue
i+1Distance of hinge axis to residue i in
(A) Distance of hinge axis to residue i in
(A) Change in
(deg) Change in
(deg) Angle of psi(i) axis to hinge axis
(deg) Angle of psi(i) axis to hinge axis
(deg) Percentage Progress
LEU-168
ASP-169
9.9
9.6
-27.3
-5.6
44.9
51.0
176.1
ASP-169
PHE-170
11.2
9.9
-5.2
35.6
25.7
21.1
-177.5
PHE-170
GLY-171
10.3
9.1
6.8
-25.7
135.3
122.0
125.5
GLY-171
LEU-172
13.7
12.8
29.2
-33.9
122.6
127.5
68.5
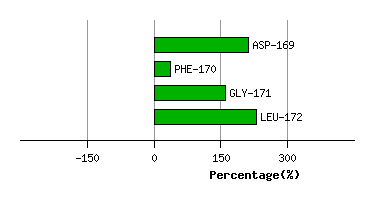
Graph shows rotational transition at bending residues and can be used
to identify hinge bending residues.
Probably only informative for interdomain rotations greater than 20 degrees
Residue
iResidue
i+1Distance of hinge axis to residue i in
(A) Distance of hinge axis to residue i in
(A) Change in
(deg) Change in
(deg) Angle of psi(i) axis to hinge axis
(deg) Angle of psi(i) axis to hinge axis
(deg) Percentage Progress
PRO-333
PRO-334
8.2
9.0
2.8
15.9
92.1
85.1
-2.6
PRO-334
PRO-335
4.7
5.3
22.7
-19.9
65.9
59.8
9.2
PRO-335
LYS-336
2.6
4.0
165.7
-75.0
140.3
120.0
-428.9
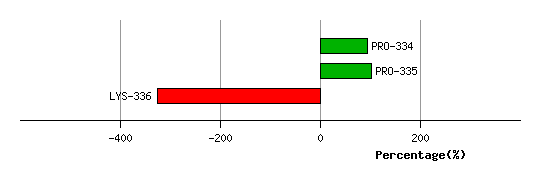
Graph shows rotational transition at bending residues and can be used
to identify hinge bending residues.
Probably only informative for interdomain rotations greater than 20 degrees