S-Arrestin
(All numbering and residues are taken from first PDB file)
![]()
![]()
Bending Residue Dihedral Analysis
Residue
iResidue
i+1Distance of hinge axis to residue i in
(A) Distance of hinge axis to residue i in
(A) Change in
(deg) Change in
(deg) Angle of psi(i) axis to hinge axis
(deg) Angle of psi(i) axis to hinge axis
(deg) Percentage Progress
VAL-177
GLN-178
2.5
2.8
5.8
-31.2
150.7
148.2
208.0
GLN-178
HIS-179
1.8
2.8
24.9
2.8
144.5
131.4
-106.0
HIS-179
ALA-180
3.6
3.3
12.0
2.9
137.4
147.5
-65.2
ALA-180
PRO-181
3.8
2.3
-10.1
-7.8
84.3
66.9
25.1
PRO-181
ARG-182
7.3
5.2
22.5
0.8
136.0
146.8
-115.1
ARG-182
ASP-183
9.6
7.3
156.2
-159.1
127.3
145.9
55.6
ASP-183
MET-184
10.6
6.8
68.8
-1.5
95.3
81.9
-16.7
MET-184
GLY-185
7.2
4.0
1.1
7.0
170.0
117.6
-47.0
GLY-185
PRO-186
7.3
6.5
8.9
-1.5
119.1
148.4
-67.3
PRO-186
GLN-187
4.7
7.5
18.0
52.0
80.8
85.1
141.2
GLN-187
PRO-188
3.0
7.2
6.7
0.4
134.5
74.0
48.8
PRO-188
ARG-189
5.2
10.3
-41.3
-70.3
113.5
55.0
136.9
ARG-189
ALA-190
7.2
13.4
-7.6
-42.7
120.8
109.6
-106.4
ALA-190
GLU-191
9.9
17.1
16.1
26.9
107.6
130.1
-63.2
GLU-191
ALA-192
13.1
20.1
-7.9
0.3
85.9
113.2
0.3
ALA-192
SER-193
16.8
23.9
-20.8
14.0
65.4
53.8
34.5
SER-193
TRP-194
20.0
27.1
4.0
1.5
69.8
60.1
7.2
TRP-194
GLN-195
23.7
30.6
-2.8
-0.4
53.5
50.6
32.1
GLN-195
PHE-196
27.0
34.1
11.6
13.2
53.2
51.5
54.5
PHE-196
PHE-197
29.9
36.8
68.4
20.2
126.3
95.4
-190.0
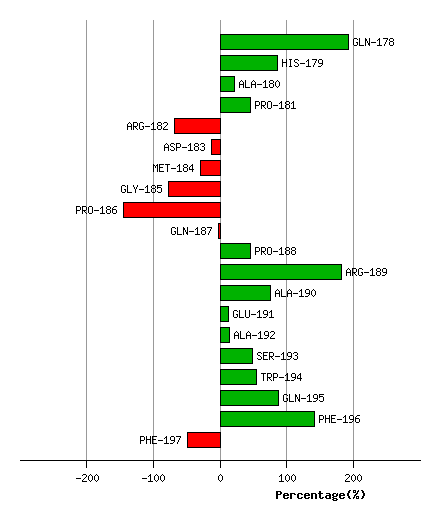
Graph shows rotational transition at bending residues and can be used
to identify hinge bending residues.
Probably only informative for interdomain rotations greater than 20 degrees
Residue
iResidue
i+1Distance of hinge axis to residue i in
(A) Distance of hinge axis to residue i in
(A) Change in
(deg) Change in
(deg) Angle of psi(i) axis to hinge axis
(deg) Angle of psi(i) axis to hinge axis
(deg) Percentage Progress
ALA-294
LEU-295
11.0
11.5
8.5
-14.4
81.5
77.0
-21.5
LEU-295
ASP-296
8.8
9.3
-26.5
35.4
78.2
78.5
-36.5
ASP-296
GLY-297
5.3
5.8
126.3
109.5
151.8
156.6
634.2
GLY-297
LYS-298
6.7
4.7
-46.0
-3.2
59.9
80.1
42.2
LYS-298
ILE-299
9.4
6.8
19.6
-29.1
68.9
126.5
-80.3
ILE-299
LYS-300
13.1
7.3
-25.0
-90.3
74.2
31.2
-984.5
LYS-300
HIS-301
14.4
9.7
101.3
161.5
65.8
72.3
-224.5
HIS-301
GLU-302
12.9
12.1
-140.2
2.2
158.9
145.7
1035.2
GLU-302
ASP-303
14.7
13.1
-166.6
6.9
131.8
133.4
-830.5
ASP-303
THR-304
11.7
14.0
139.5
-46.0
71.3
53.6
185.2
THR-304
ASN-305
10.0
11.1
40.5
12.3
21.4
31.6
238.9
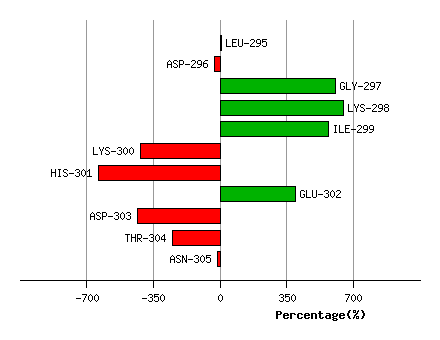
Graph shows rotational transition at bending residues and can be used
to identify hinge bending residues.
Probably only informative for interdomain rotations greater than 20 degrees
Residue
iResidue
i+1Distance of hinge axis to residue i in
(A) Distance of hinge axis to residue i in
(A) Change in
(deg) Change in
(deg) Angle of psi(i) axis to hinge axis
(deg) Angle of psi(i) axis to hinge axis
(deg) Percentage Progress
GLY-322
ILE-323
12.1
11.3
-120.3
42.7
107.9
129.6
-206.3
ILE-323
LEU-324
11.5
10.6
-6.8
-9.4
167.9
153.5
-64.4
LEU-324
VAL-325
11.9
10.7
2.5
-1.4
65.9
52.8
41.0
VAL-325
SER-326
10.6
10.0
-3.1
3.1
170.0
166.4
-5.0
SER-326
TYR-327
11.3
10.9
-10.5
12.0
112.0
113.6
14.2
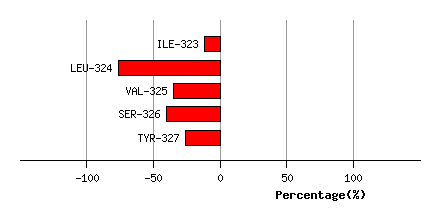
Graph shows rotational transition at bending residues and can be used
to identify hinge bending residues.
Probably only informative for interdomain rotations greater than 20 degrees