Thermolysin
(All numbering and residues are taken from first PDB file)
![]()
![]()
Bending Residue Dihedral Analysis
Residue
iResidue
i+1Distance of hinge axis to residue i in
(A) Distance of hinge axis to residue i in
(A) Change in
(deg) Change in
(deg) Angle of psi(i) axis to hinge axis
(deg) Angle of psi(i) axis to hinge axis
(deg) Percentage Progress
TYR-83
TYR-84
2.3
2.2
4.8
-3.7
45.0
43.6
46.3
TYR-84
LYS-85
1.1
1.2
-0.6
-1.4
157.2
158.5
-37.8
LYS-85
ASN-86
1.6
1.6
4.7
-2.8
66.5
67.6
45.0

Graph shows rotational transition at bending residues and can be used
to identify hinge bending residues.
Probably only informative for interdomain rotations greater than 20 degrees
Residue
iResidue
i+1Distance of hinge axis to residue i in
(A) Distance of hinge axis to residue i in
(A) Change in
(deg) Change in
(deg) Angle of psi(i) axis to hinge axis
(deg) Angle of psi(i) axis to hinge axis
(deg) Percentage Progress
ASN-89
ARG-90
1.4
1.4
3.3
-5.6
77.5
79.8
36.0
ARG-90
LEU-91
3.9
3.9
0.4
-1.3
71.9
70.8
27.0
LEU-91
SER-92
5.8
5.9
0.1
-4.1
42.5
46.0
-13.3
SER-92
TYR-93
7.2
7.5
0.2
-5.8
79.5
85.5
-39.0
TYR-93
ASP-94
8.7
9.1
10.0
-7.9
132.7
134.3
13.1
ASP-94
GLY-95
11.2
11.6
-4.0
4.7
24.4
27.2
34.4
GLY-95
ASN-96
8.7
8.9
5.6
-9.2
126.3
126.8
12.1
ASN-96
ASN-97
10.9
11.0
8.0
-4.5
64.6
59.1
-42.6
ASN-97
ALA-98
10.4
10.6
2.5
5.8
52.6
53.3
136.2
ALA-98
ALA-99
13.0
13.2
-3.7
-7.1
136.0
139.0
-156.5

Graph shows rotational transition at bending residues and can be used
to identify hinge bending residues.
Probably only informative for interdomain rotations greater than 20 degrees
Residue
iResidue
i+1Distance of hinge axis to residue i in
(A) Distance of hinge axis to residue i in
(A) Change in
(deg) Change in
(deg) Angle of psi(i) axis to hinge axis
(deg) Angle of psi(i) axis to hinge axis
(deg) Percentage Progress
GLY-135
GLY-136
4.5
4.5
0.8
4.9
67.2
67.6
47.4
GLY-136
ILE-137
1.1
1.1
6.4
0.2
9.8
6.4
45.4
ILE-137
ASP-138
1.5
1.6
0.6
-5.8
73.9
72.3
-11.5
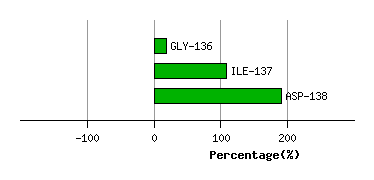
Graph shows rotational transition at bending residues and can be used
to identify hinge bending residues.
Probably only informative for interdomain rotations greater than 20 degrees
Residue
iResidue
i+1Distance of hinge axis to residue i in
(A) Distance of hinge axis to residue i in
(A) Change in
(deg) Change in
(deg) Angle of psi(i) axis to hinge axis
(deg) Angle of psi(i) axis to hinge axis
(deg) Percentage Progress
TYR-179
ALA-180
7.7
7.6
1.7
-4.1
66.0
68.2
-61.4
ALA-180
ASN-181
7.7
7.9
1.5
-4.0
66.6
64.5
-17.1
ASN-181
LYS-182
10.9
10.8
1.5
-4.9
39.4
30.9
20.6
LYS-182
ASN-183
11.3
10.4
161.8
-174.9
40.5
48.7
-31.8
ASN-183
PRO-184
10.5
11.2
-1.3
5.2
81.8
74.6
42.0
PRO-184
ASP-185
10.0
10.2
-5.0
3.4
119.0
116.1
86.7
ASP-185
TRP-186
11.4
11.4
0.4
1.8
110.1
108.1
-1.8

Graph shows rotational transition at bending residues and can be used
to identify hinge bending residues.
Probably only informative for interdomain rotations greater than 20 degrees