Beta-Catenin
(All numbering and residues are taken from first PDB file)
![]()
![]()
Bending Residue Dihedral Analysis
Residue
iResidue
i+1Distance of hinge axis to residue i in
(A) Distance of hinge axis to residue i in
(A) Change in
(deg) Change in
(deg) Angle of psi(i) axis to hinge axis
(deg) Angle of psi(i) axis to hinge axis
(deg) Percentage Progress
GLY-367
LEU-368
3.7
3.8
12.8
-15.1
43.2
44.5
-44.8
LEU-368
HIS-369
3.7
3.8
4.1
-6.4
66.4
62.9
7.3
HIS-369
LEU-370
1.2
1.2
6.5
-4.5
125.1
125.0
28.0
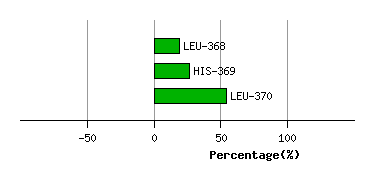
Graph shows rotational transition at bending residues and can be used
to identify hinge bending residues.
Probably only informative for interdomain rotations greater than 20 degrees
Residue
iResidue
i+1Distance of hinge axis to residue i in
(A) Distance of hinge axis to residue i in
(A) Change in
(deg) Change in
(deg) Angle of psi(i) axis to hinge axis
(deg) Angle of psi(i) axis to hinge axis
(deg) Percentage Progress
ASP-372
PRO-373
4.2
3.9
0.3
8.7
92.9
94.9
-74.7
PRO-373
SER-374
7.8
7.4
-19.5
12.0
89.2
94.2
12.1
SER-374
GLN-375
8.3
8.0
15.2
-13.0
25.0
21.4
26.8
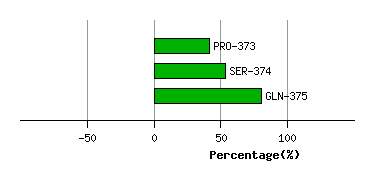
Graph shows rotational transition at bending residues and can be used
to identify hinge bending residues.
Probably only informative for interdomain rotations greater than 20 degrees
Residue
iResidue
i+1Distance of hinge axis to residue i in
(A) Distance of hinge axis to residue i in
(A) Change in
(deg) Change in
(deg) Angle of psi(i) axis to hinge axis
(deg) Angle of psi(i) axis to hinge axis
(deg) Percentage Progress
LEU-388
SER-389
12.7
12.8
10.2
18.9
140.4
141.8
-289.6
SER-389
ASP-390
10.2
10.2
-12.9
-3.0
24.4
31.7
161.2
ASP-390
ALA-391
12.4
12.7
-115.1
173.3
78.3
95.0
-15.7
ALA-391
ALA-392
14.3
15.0
-20.2
-35.1
136.5
114.8
-564.6
ALA-392
THR-393
14.4
12.8
-141.1
-4.7
68.1
48.6
1485.8
THR-393
LYS-394
16.1
12.3
-138.3
-67.2
98.4
87.0
415.8
LYS-394
GLN-395
14.5
15.1
-127.9
33.1
155.6
145.9
-1282.7
GLN-395
GLU-396
13.9
14.1
-13.2
1.9
91.7
84.2
63.3
GLU-396
GLY-397
14.4
14.5
12.7
-9.6
44.2
38.7
24.1
GLU-399
GLY-400
9.1
9.5
1.5
-0.9
57.5
53.8
-9.4
GLY-400
LEU-401
7.2
7.6
2.2
-5.5
102.4
100.1
60.7
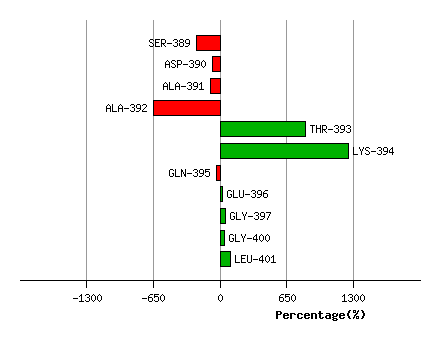
Graph shows rotational transition at bending residues and can be used
to identify hinge bending residues.
Probably only informative for interdomain rotations greater than 20 degrees
Residue
iResidue
i+1Distance of hinge axis to residue i in
(A) Distance of hinge axis to residue i in
(A) Change in
(deg) Change in
(deg) Angle of psi(i) axis to hinge axis
(deg) Angle of psi(i) axis to hinge axis
(deg) Percentage Progress
SER-425
ASN-426
4.8
4.9
0.5
-10.2
96.2
90.6
7.0
ASN-426
LEU-427
7.7
7.8
13.8
-5.3
96.0
101.0
-53.5
LEU-427
THR-428
6.8
6.8
-4.3
0.5
139.6
140.4
-26.7
THR-428
CYS-429
5.7
5.6
20.1
-24.7
37.2
36.3
-65.8
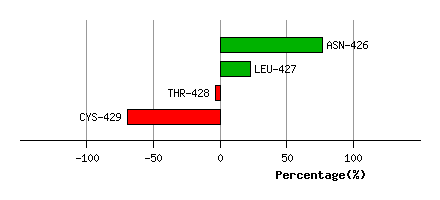
Graph shows rotational transition at bending residues and can be used
to identify hinge bending residues.
Probably only informative for interdomain rotations greater than 20 degrees