Preprotein Translocase Seca Subunit
(All numbering and residues are taken from first PDB file)
![]()
![]()
Bending Residue Dihedral Analysis
Residue
iResidue
i+1Distance of hinge axis to residue i in
(A) Distance of hinge axis to residue i in
(A) Change in
(deg) Change in
(deg) Angle of psi(i) axis to hinge axis
(deg) Angle of psi(i) axis to hinge axis
(deg) Percentage Progress
MET-390
THR-391
15.0
15.5
-10.6
-15.8
122.8
118.1
-41.9
THR-391
GLY-392
12.0
12.5
-22.1
0.5
68.9
84.9
10.5
GLY-392
THR-393
8.3
8.7
-159.4
-84.0
130.6
156.3
364.5
THR-393
ALA-394
5.3
8.6
118.6
-108.1
32.4
55.3
51.6
ALA-394
ASP-395
5.1
10.7
9.6
-95.3
30.5
61.3
-206.3
ASP-395
THR-396
6.9
9.9
73.2
-122.0
12.1
6.2
-197.2
THR-396
GLU-397
6.1
8.5
-26.0
25.1
122.6
122.7
3.6
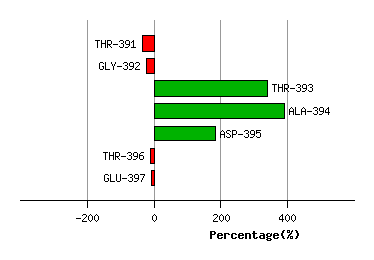
Graph shows rotational transition at bending residues and can be used
to identify hinge bending residues.
Probably only informative for interdomain rotations greater than 20 degrees
Residue
iResidue
i+1Distance of hinge axis to residue i in
(A) Distance of hinge axis to residue i in
(A) Change in
(deg) Change in
(deg) Angle of psi(i) axis to hinge axis
(deg) Angle of psi(i) axis to hinge axis
(deg) Percentage Progress
ARG-416
PRO-417
4.5
3.7
-7.8
4.4
154.2
150.4
-11.5
PRO-417
MET-418
6.2
5.0
9.1
-3.3
67.8
76.1
6.4
MET-418
ILE-419
4.4
3.3
-7.0
21.1
100.8
97.1
33.1
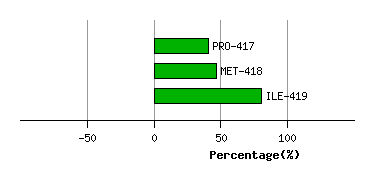
Graph shows rotational transition at bending residues and can be used
to identify hinge bending residues.
Probably only informative for interdomain rotations greater than 20 degrees
Residue
iResidue
i+1Distance of hinge axis to residue i in
(A) Distance of hinge axis to residue i in
(A) Change in
(deg) Change in
(deg) Angle of psi(i) axis to hinge axis
(deg) Angle of psi(i) axis to hinge axis
(deg) Percentage Progress
ILE-502
ALA-503
21.1
21.6
-8.6
-1.1
79.9
82.1
29.4
ALA-503
THR-504
19.8
20.2
-8.5
28.9
14.7
23.6
-71.9
THR-504
ASN-505
20.3
20.1
13.8
-76.2
96.5
76.4
20.3
ASN-505
MET-506
17.6
17.0
-84.7
-45.2
147.7
112.3
558.1
MET-506
ALA-507
16.1
19.4
-128.0
16.5
80.6
152.1
-203.5
ALA-507
GLY-508
15.8
20.5
-125.3
158.9
127.6
140.7
51.3
GLY-508
ARG-509
15.8
19.2
-91.3
-117.6
142.4
92.3
-350.4
ARG-509
GLY-510
12.6
17.3
160.8
24.7
57.4
37.1
720.8
GLY-510
THR-511
13.5
16.8
-127.5
-73.8
163.3
153.9
-714.4
THR-511
ASP-512
15.0
16.3
-3.6
-5.8
101.9
93.7
-7.3
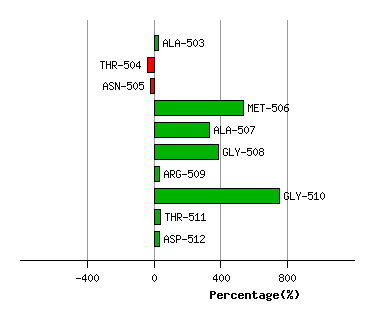
Graph shows rotational transition at bending residues and can be used
to identify hinge bending residues.
Probably only informative for interdomain rotations greater than 20 degrees
Residue
iResidue
i+1Distance of hinge axis to residue i in
(A) Distance of hinge axis to residue i in
(A) Change in
(deg) Change in
(deg) Angle of psi(i) axis to hinge axis
(deg) Angle of psi(i) axis to hinge axis
(deg) Percentage Progress
ALA-630
GLN-631
2.7
4.1
-7.5
4.9
112.9
125.1
18.3
GLN-631
ARG-632
3.5
4.7
0.2
-7.3
90.4
92.3
31.6
ARG-632
LYS-633
2.3
2.7
10.9
-10.6
154.5
147.6
-17.6
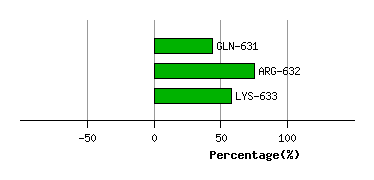
Graph shows rotational transition at bending residues and can be used
to identify hinge bending residues.
Probably only informative for interdomain rotations greater than 20 degrees