Udp-Galactose 4-Epimerase
(All numbering and residues are taken from first PDB file)
![]()
![]()
Bending Residue Dihedral Analysis
Residue
iResidue
i+1Distance of hinge axis to residue i in
(A) Distance of hinge axis to residue i in
(A) Change in
(deg) Change in
(deg) Angle of psi(i) axis to hinge axis
(deg) Angle of psi(i) axis to hinge axis
(deg) Percentage Progress
SER-130
SER-131
10.8
10.6
4.6
-9.4
133.2
131.5
62.3
SER-131
SER-132
9.7
9.5
-4.9
5.9
111.0
111.5
12.5
SER-132
ALA-133
8.6
8.4
-6.5
2.4
48.2
44.9
3.4
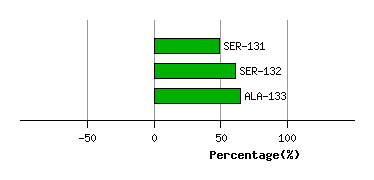
Graph shows rotational transition at bending residues and can be used
to identify hinge bending residues.
Probably only informative for interdomain rotations greater than 20 degrees
Residue
iResidue
i+1Distance of hinge axis to residue i in
(A) Distance of hinge axis to residue i in
(A) Change in
(deg) Change in
(deg) Angle of psi(i) axis to hinge axis
(deg) Angle of psi(i) axis to hinge axis
(deg) Percentage Progress
VAL-135
TYR-136
10.9
10.6
-3.3
-1.9
136.1
137.2
-7.8
TYR-136
GLY-137
9.7
9.4
-1.7
5.8
104.0
103.2
-36.9
GLY-137
ASN-138
13.5
13.1
-13.2
12.7
80.3
81.5
31.2
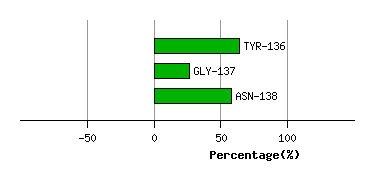
Graph shows rotational transition at bending residues and can be used
to identify hinge bending residues.
Probably only informative for interdomain rotations greater than 20 degrees
Residue
iResidue
i+1Distance of hinge axis to residue i in
(A) Distance of hinge axis to residue i in
(A) Change in
(deg) Change in
(deg) Angle of psi(i) axis to hinge axis
(deg) Angle of psi(i) axis to hinge axis
(deg) Percentage Progress
PRO-139
GLN-140
12.7
12.6
-6.1
8.6
37.4
35.0
-0.1
GLN-140
TYR-141
13.0
12.7
-8.9
0.6
94.8
91.7
-37.0
TYR-141
LEU-142
12.1
12.0
1.0
7.1
23.8
28.4
108.2
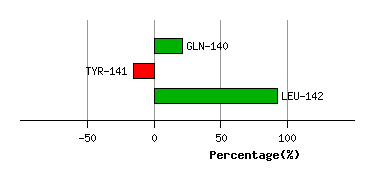
Graph shows rotational transition at bending residues and can be used
to identify hinge bending residues.
Probably only informative for interdomain rotations greater than 20 degrees
Residue
iResidue
i+1Distance of hinge axis to residue i in
(A) Distance of hinge axis to residue i in
(A) Change in
(deg) Change in
(deg) Angle of psi(i) axis to hinge axis
(deg) Angle of psi(i) axis to hinge axis
(deg) Percentage Progress
PRO-143
LEU-144
9.6
9.5
3.2
-1.2
51.3
55.8
41.6
LEU-144
ASP-145
6.7
6.5
-0.4
3.7
95.4
93.8
15.5
ASP-145
GLU-146
3.7
3.6
-6.8
1.8
109.4
106.2
-37.4
GLU-146
ALA-147
0.9
0.8
-2.8
1.0
160.6
159.5
-57.4
ALA-147
HIS-148
1.8
1.6
2.9
5.4
84.0
83.2
63.4
HIS-148
PRO-149
5.5
5.3
2.9
3.0
79.4
77.5
47.6
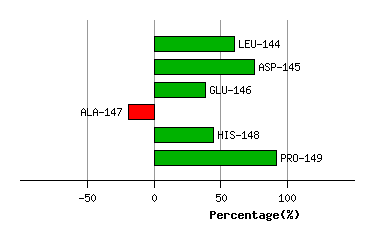
Graph shows rotational transition at bending residues and can be used
to identify hinge bending residues.
Probably only informative for interdomain rotations greater than 20 degrees
Residue
iResidue
i+1Distance of hinge axis to residue i in
(A) Distance of hinge axis to residue i in
(A) Change in
(deg) Change in
(deg) Angle of psi(i) axis to hinge axis
(deg) Angle of psi(i) axis to hinge axis
(deg) Percentage Progress
ARG-184
TYR-185
5.4
5.1
5.3
1.8
39.6
40.4
47.5
TYR-185
PHE-186
4.7
4.6
-7.4
0.6
85.5
82.4
-6.0
PHE-186
ASN-187
5.5
5.4
9.5
1.3
31.7
34.9
95.8
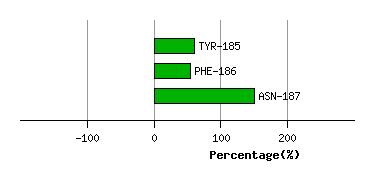
Graph shows rotational transition at bending residues and can be used
to identify hinge bending residues.
Probably only informative for interdomain rotations greater than 20 degrees
Residue
iResidue
i+1Distance of hinge axis to residue i in
(A) Distance of hinge axis to residue i in
(A) Change in
(deg) Change in
(deg) Angle of psi(i) axis to hinge axis
(deg) Angle of psi(i) axis to hinge axis
(deg) Percentage Progress
THR-189
GLY-190
5.7
5.6
-3.7
0.4
49.5
50.9
142.3
GLY-190
ALA-191
4.1
3.9
-1.3
-2.8
63.6
62.2
42.5
ALA-191
HIS-192
2.3
2.1
-1.5
-0.8
74.0
72.4
-32.0
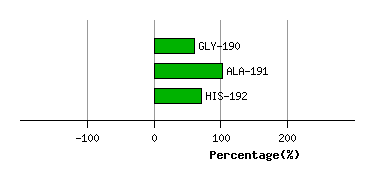
Graph shows rotational transition at bending residues and can be used
to identify hinge bending residues.
Probably only informative for interdomain rotations greater than 20 degrees
Residue
iResidue
i+1Distance of hinge axis to residue i in
(A) Distance of hinge axis to residue i in
(A) Change in
(deg) Change in
(deg) Angle of psi(i) axis to hinge axis
(deg) Angle of psi(i) axis to hinge axis
(deg) Percentage Progress
CYS-196
ILE-197
5.3
5.1
2.4
-1.4
132.5
132.1
-78.1
ILE-197
GLY-198
6.7
6.6
5.7
-11.9
123.5
126.4
112.1
GLY-198
GLU-199
6.7
6.5
-9.1
17.4
59.8
65.5
-118.3
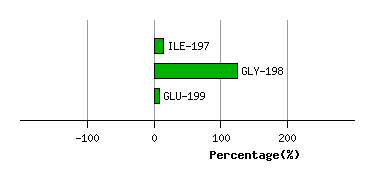
Graph shows rotational transition at bending residues and can be used
to identify hinge bending residues.
Probably only informative for interdomain rotations greater than 20 degrees
Residue
iResidue
i+1Distance of hinge axis to residue i in
(A) Distance of hinge axis to residue i in
(A) Change in
(deg) Change in
(deg) Angle of psi(i) axis to hinge axis
(deg) Angle of psi(i) axis to hinge axis
(deg) Percentage Progress
ASP-240
TYR-241
8.5
8.4
-7.6
5.6
37.6
38.2
26.7
TYR-241
ILE-242
7.4
7.4
-3.7
4.1
85.3
85.1
49.5
ILE-242
HIS-243
3.9
3.8
-4.8
-3.6
30.5
31.5
67.8
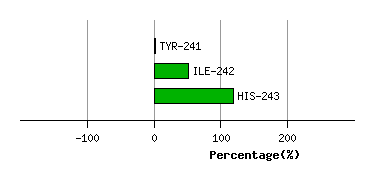
Graph shows rotational transition at bending residues and can be used
to identify hinge bending residues.
Probably only informative for interdomain rotations greater than 20 degrees
Residue
iResidue
i+1Distance of hinge axis to residue i in
(A) Distance of hinge axis to residue i in
(A) Change in
(deg) Change in
(deg) Angle of psi(i) axis to hinge axis
(deg) Angle of psi(i) axis to hinge axis
(deg) Percentage Progress
TYR-267
ASN-268
4.0
4.1
3.4
-0.6
52.2
53.0
96.1
ASN-268
LEU-269
1.0
1.0
-1.4
5.5
149.9
151.7
17.1
LEU-269
GLY-270
0.8
1.0
-4.3
5.0
114.6
111.5
-38.2
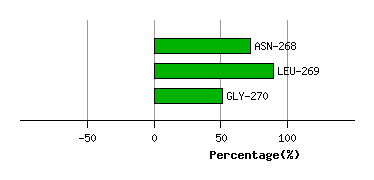
Graph shows rotational transition at bending residues and can be used
to identify hinge bending residues.
Probably only informative for interdomain rotations greater than 20 degrees
Residue
iResidue
i+1Distance of hinge axis to residue i in
(A) Distance of hinge axis to residue i in
(A) Change in
(deg) Change in
(deg) Angle of psi(i) axis to hinge axis
(deg) Angle of psi(i) axis to hinge axis
(deg) Percentage Progress
CYS-307
TYR-308
11.5
11.4
-8.1
-1.9
56.0
61.0
88.4
TYR-308
ALA-309
8.9
8.9
-0.9
3.9
129.9
127.8
29.5
ALA-309
ASN-310
5.9
5.8
-1.5
5.1
108.2
111.8
73.6
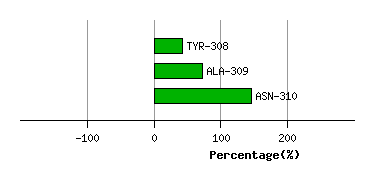
Graph shows rotational transition at bending residues and can be used
to identify hinge bending residues.
Probably only informative for interdomain rotations greater than 20 degrees
Residue
iResidue
i+1Distance of hinge axis to residue i in
(A) Distance of hinge axis to residue i in
(A) Change in
(deg) Change in
(deg) Angle of psi(i) axis to hinge axis
(deg) Angle of psi(i) axis to hinge axis
(deg) Percentage Progress
PRO-311
SER-312
4.8
5.6
-5.1
0.8
69.6
63.8
17.8
SER-312
LEU-313
7.4
7.8
-7.7
-4.3
74.2
78.6
3.6
LEU-313
ALA-314
6.2
6.5
4.3
-1.6
42.0
38.6
25.2
ALA-314
GLN-315
6.4
6.5
-1.0
-0.1
110.6
110.9
8.1
GLN-315
GLU-316
9.2
9.4
-2.0
0.6
52.7
54.4
-24.2
GLU-316
GLU-317
11.0
11.4
2.3
2.9
92.1
93.8
62.2
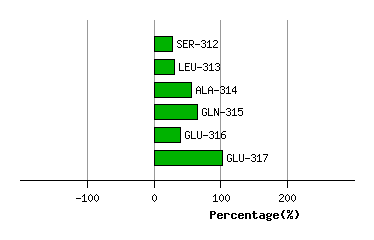
Graph shows rotational transition at bending residues and can be used
to identify hinge bending residues.
Probably only informative for interdomain rotations greater than 20 degrees
Residue
iResidue
i+1Distance of hinge axis to residue i in
(A) Distance of hinge axis to residue i in
(A) Change in
(deg) Change in
(deg) Angle of psi(i) axis to hinge axis
(deg) Angle of psi(i) axis to hinge axis
(deg) Percentage Progress
LEU-318
GLY-319
10.8
10.5
-2.7
3.9
48.8
50.6
-26.1
GLY-319
TRP-320
12.3
12.2
-5.0
-5.7
32.6
30.9
110.0
TRP-320
THR-321
9.3
9.4
-2.2
6.0
94.3
92.0
42.5
THR-321
ALA-322
8.1
8.2
2.8
8.0
153.8
156.9
-141.2
ALA-322
ALA-323
6.1
6.4
17.5
-23.0
117.5
121.9
115.1
ALA-323
LEU-324
8.7
8.9
32.2
-28.9
122.0
130.4
-81.3
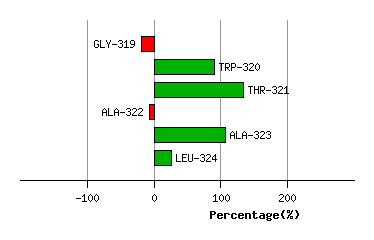
Graph shows rotational transition at bending residues and can be used
to identify hinge bending residues.
Probably only informative for interdomain rotations greater than 20 degrees
Residue
iResidue
i+1Distance of hinge axis to residue i in
(A) Distance of hinge axis to residue i in
(A) Change in
(deg) Change in
(deg) Angle of psi(i) axis to hinge axis
(deg) Angle of psi(i) axis to hinge axis
(deg) Percentage Progress
TRP-336
GLN-337
4.9
5.1
-0.8
-3.4
67.6
69.1
33.7
GLN-337
LYS-338
8.7
8.7
8.0
-8.2
170.3
166.0
-19.2
LYS-338
GLN-339
8.4
8.6
2.5
-6.4
123.9
130.1
146.1
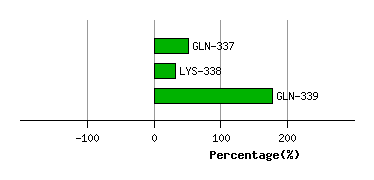
Graph shows rotational transition at bending residues and can be used
to identify hinge bending residues.
Probably only informative for interdomain rotations greater than 20 degrees